
What's Next?
The clock is ticking

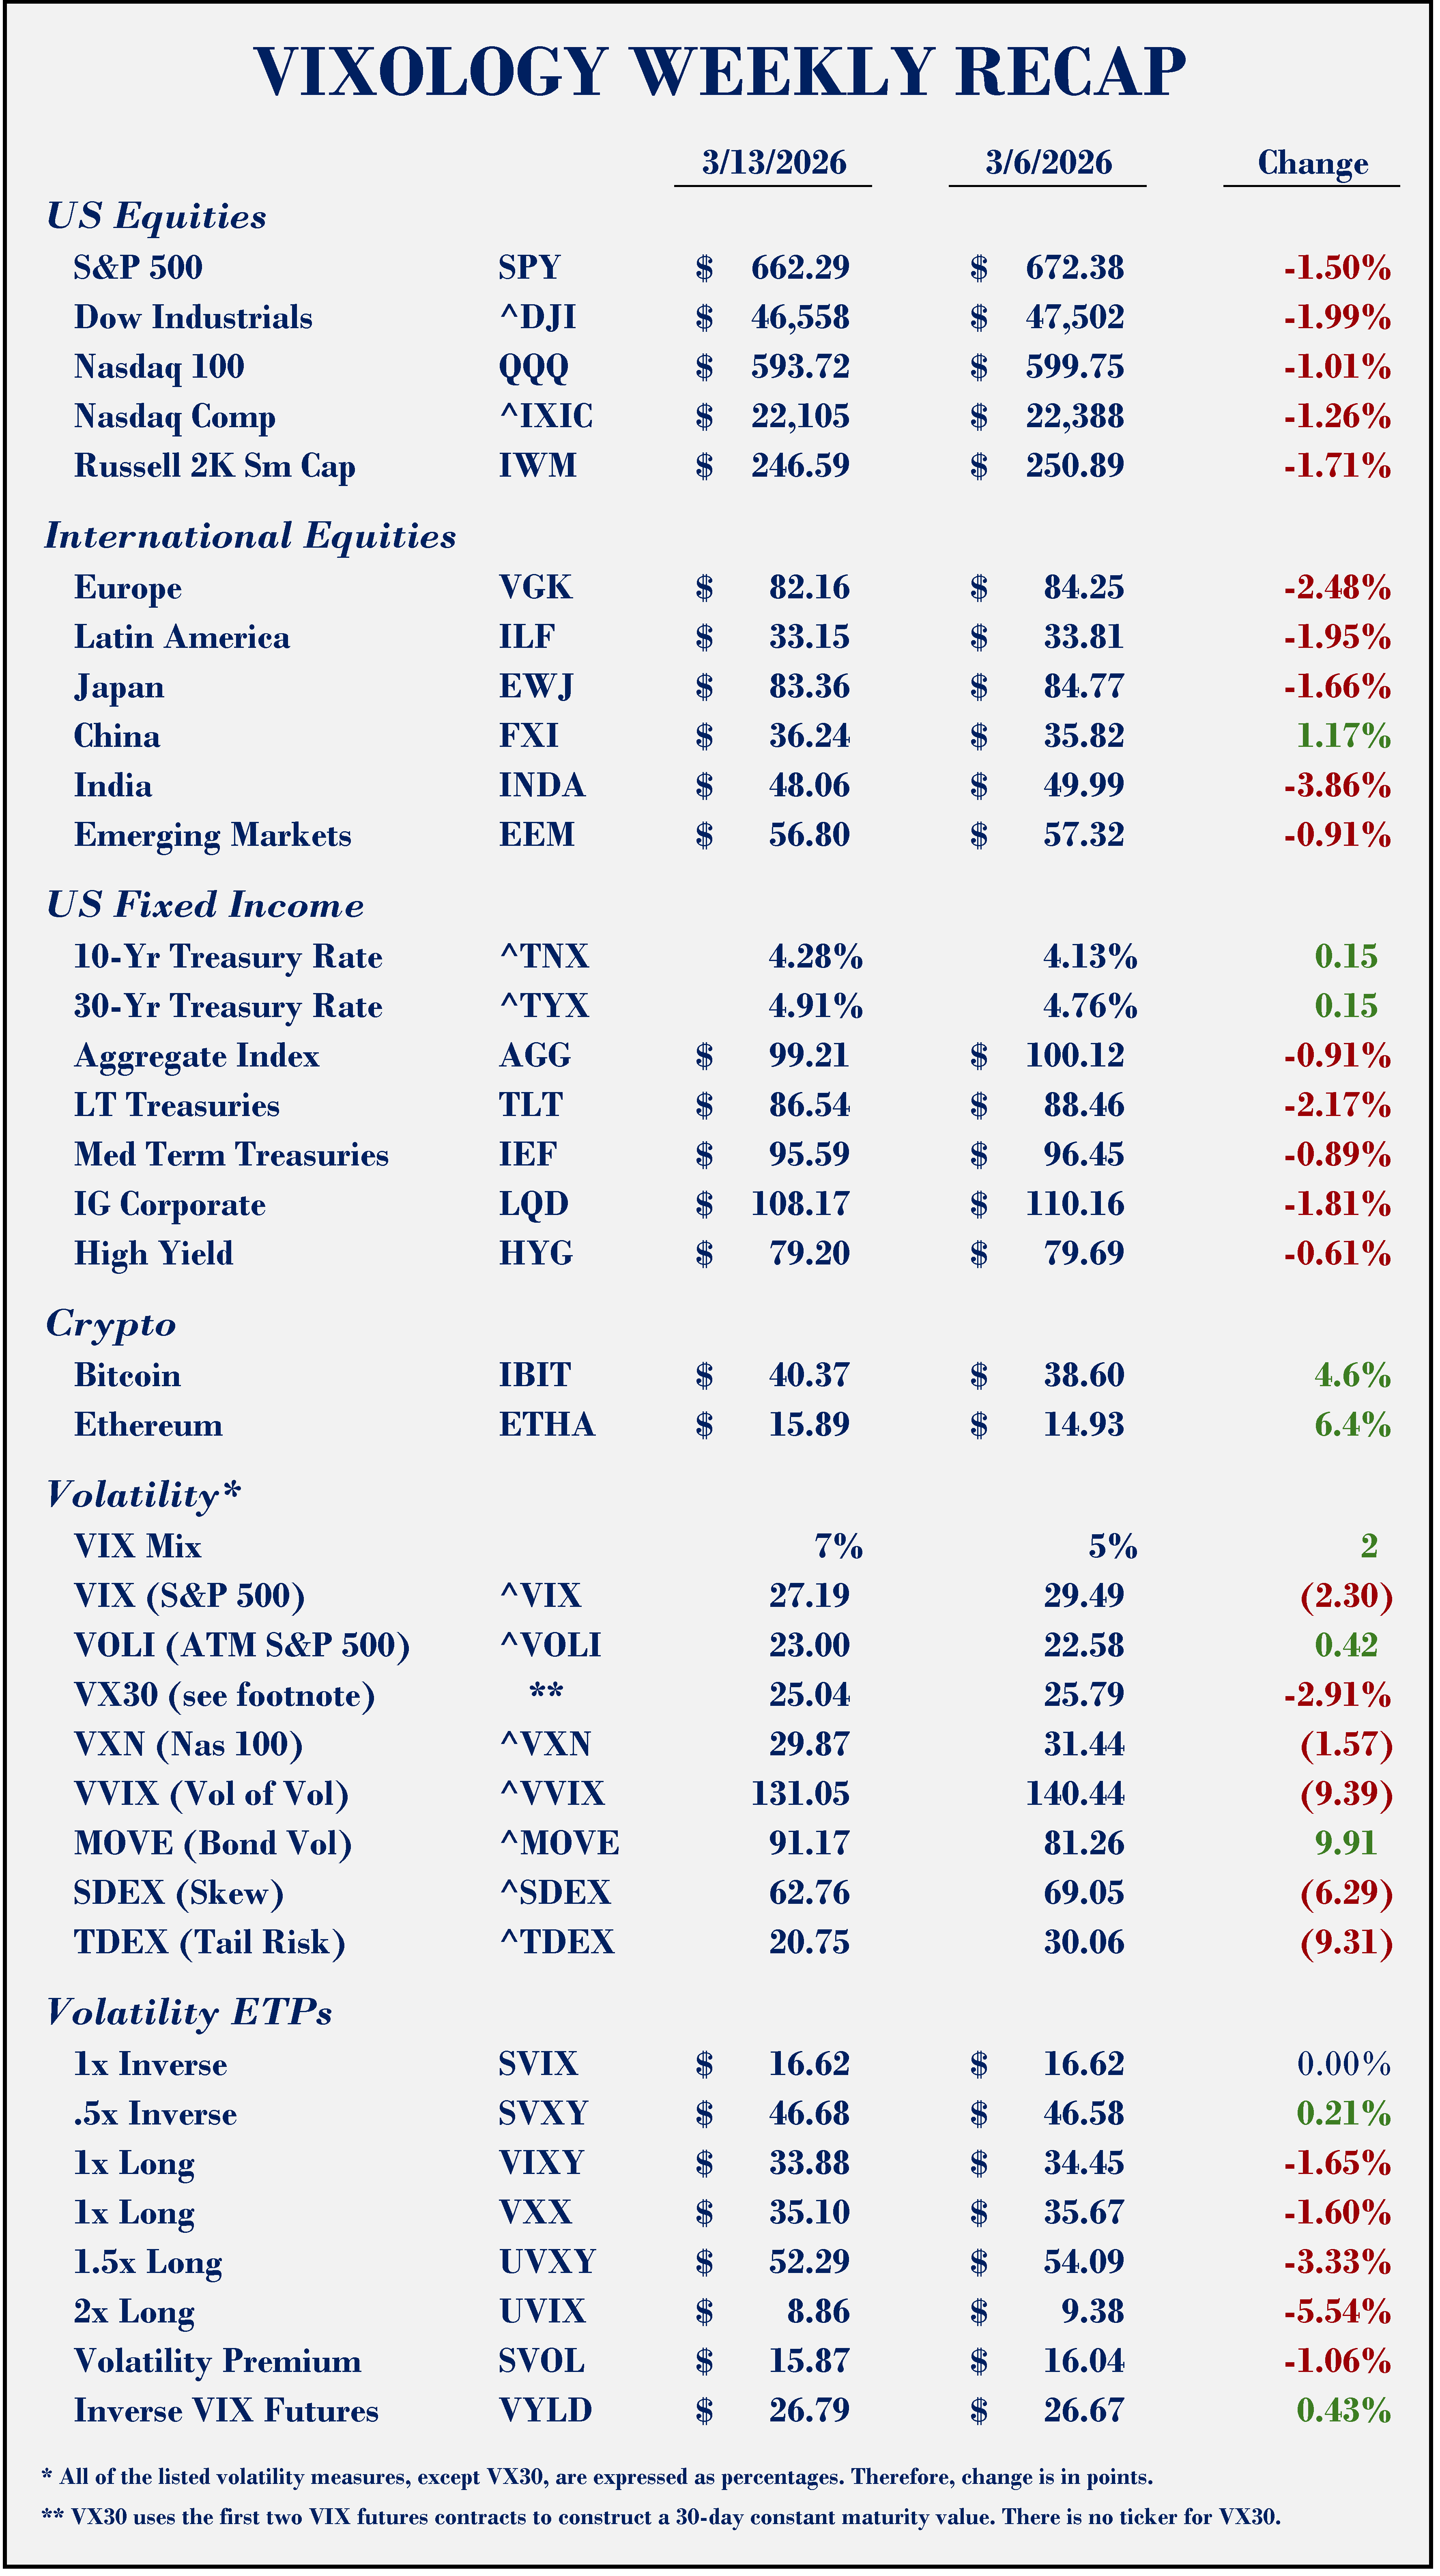
Some mixed signals across markets last week. On the one hand, equity indices were all red except for China. Interest rates ticked higher and all of our credit benchmarks finished lower. So much for bonds as a hedge. On the other hand, crypto showed a bit of risk appetite and the long vol ETFs lost ground week over week. In the volatility complex, VIX was lower from Friday to Friday and tail risk (TDEX) was down in a big way. So equities continued to slide, but measures of volatility showed less concern. I am not prepared to see this as a bullish divergence given the lack of progress in the Middle East.
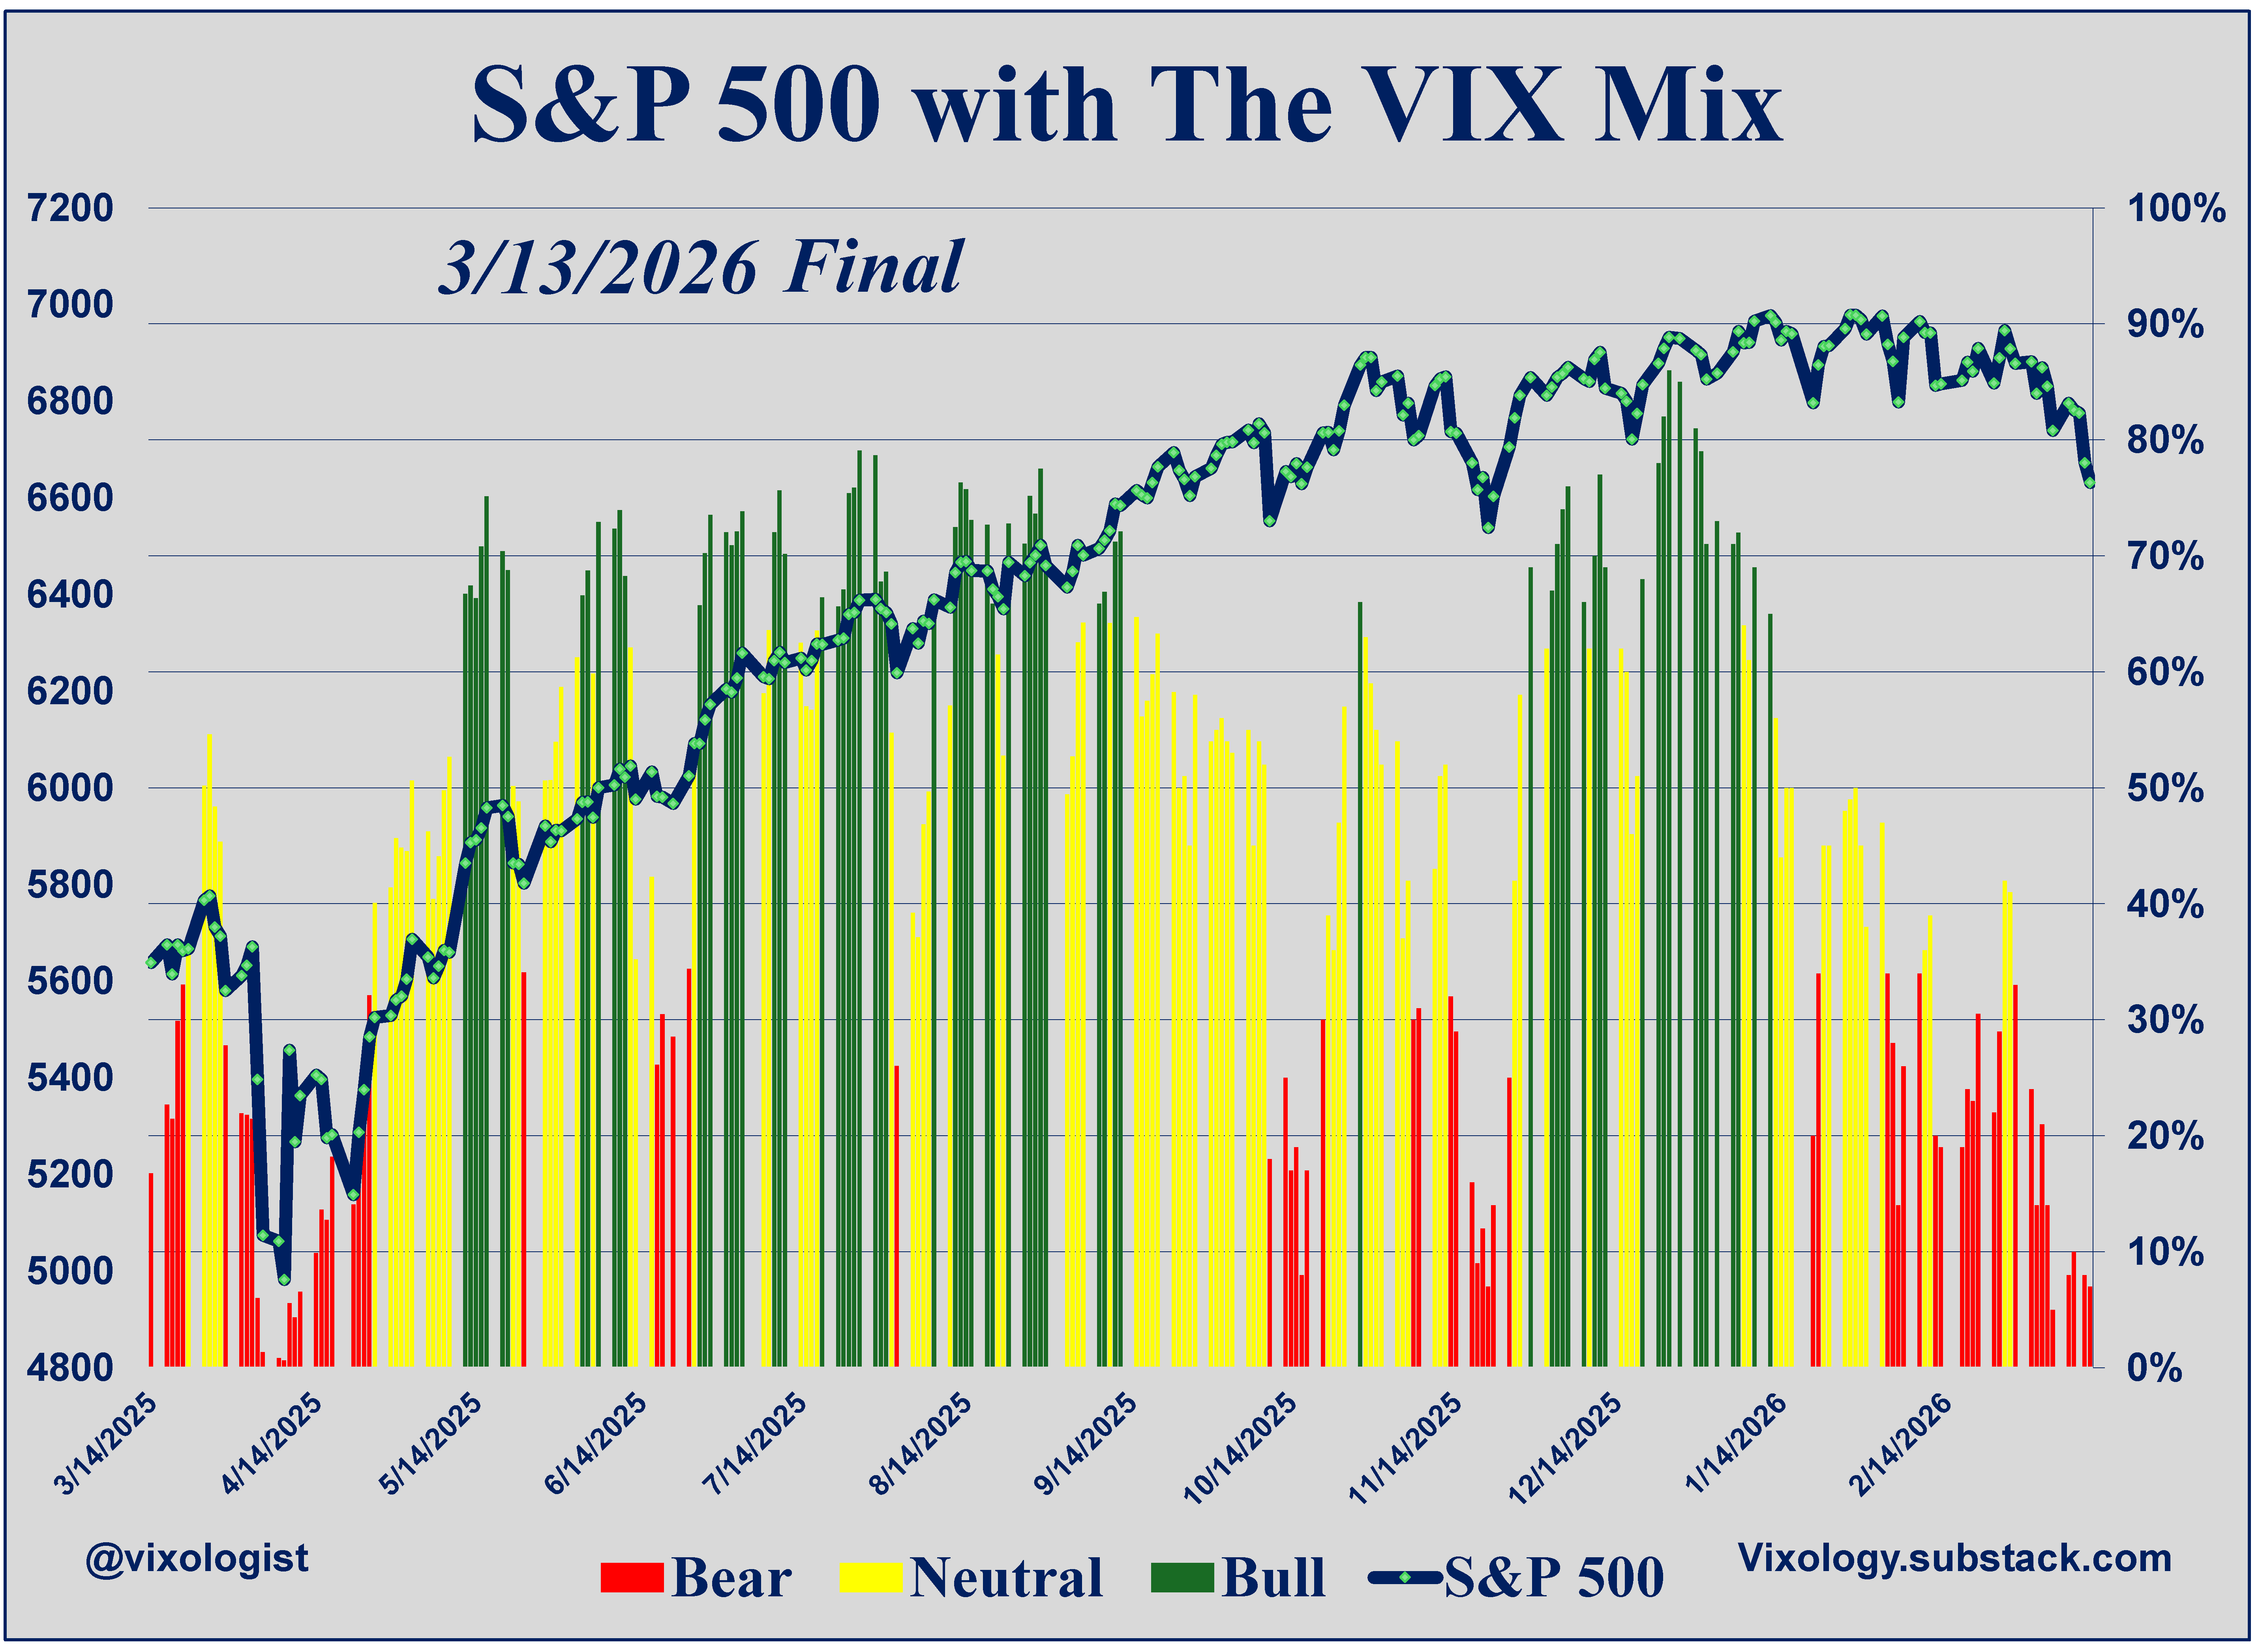
One of the subtle improvements saw the VIX Mix add two points over the week. But it remains deep in bear territory. This could be the makings of a bottom for stocks but we need to keep in mind that all 17 of the underlying indicators also sit in the red and 14 of 17 are below the 10% waterline.
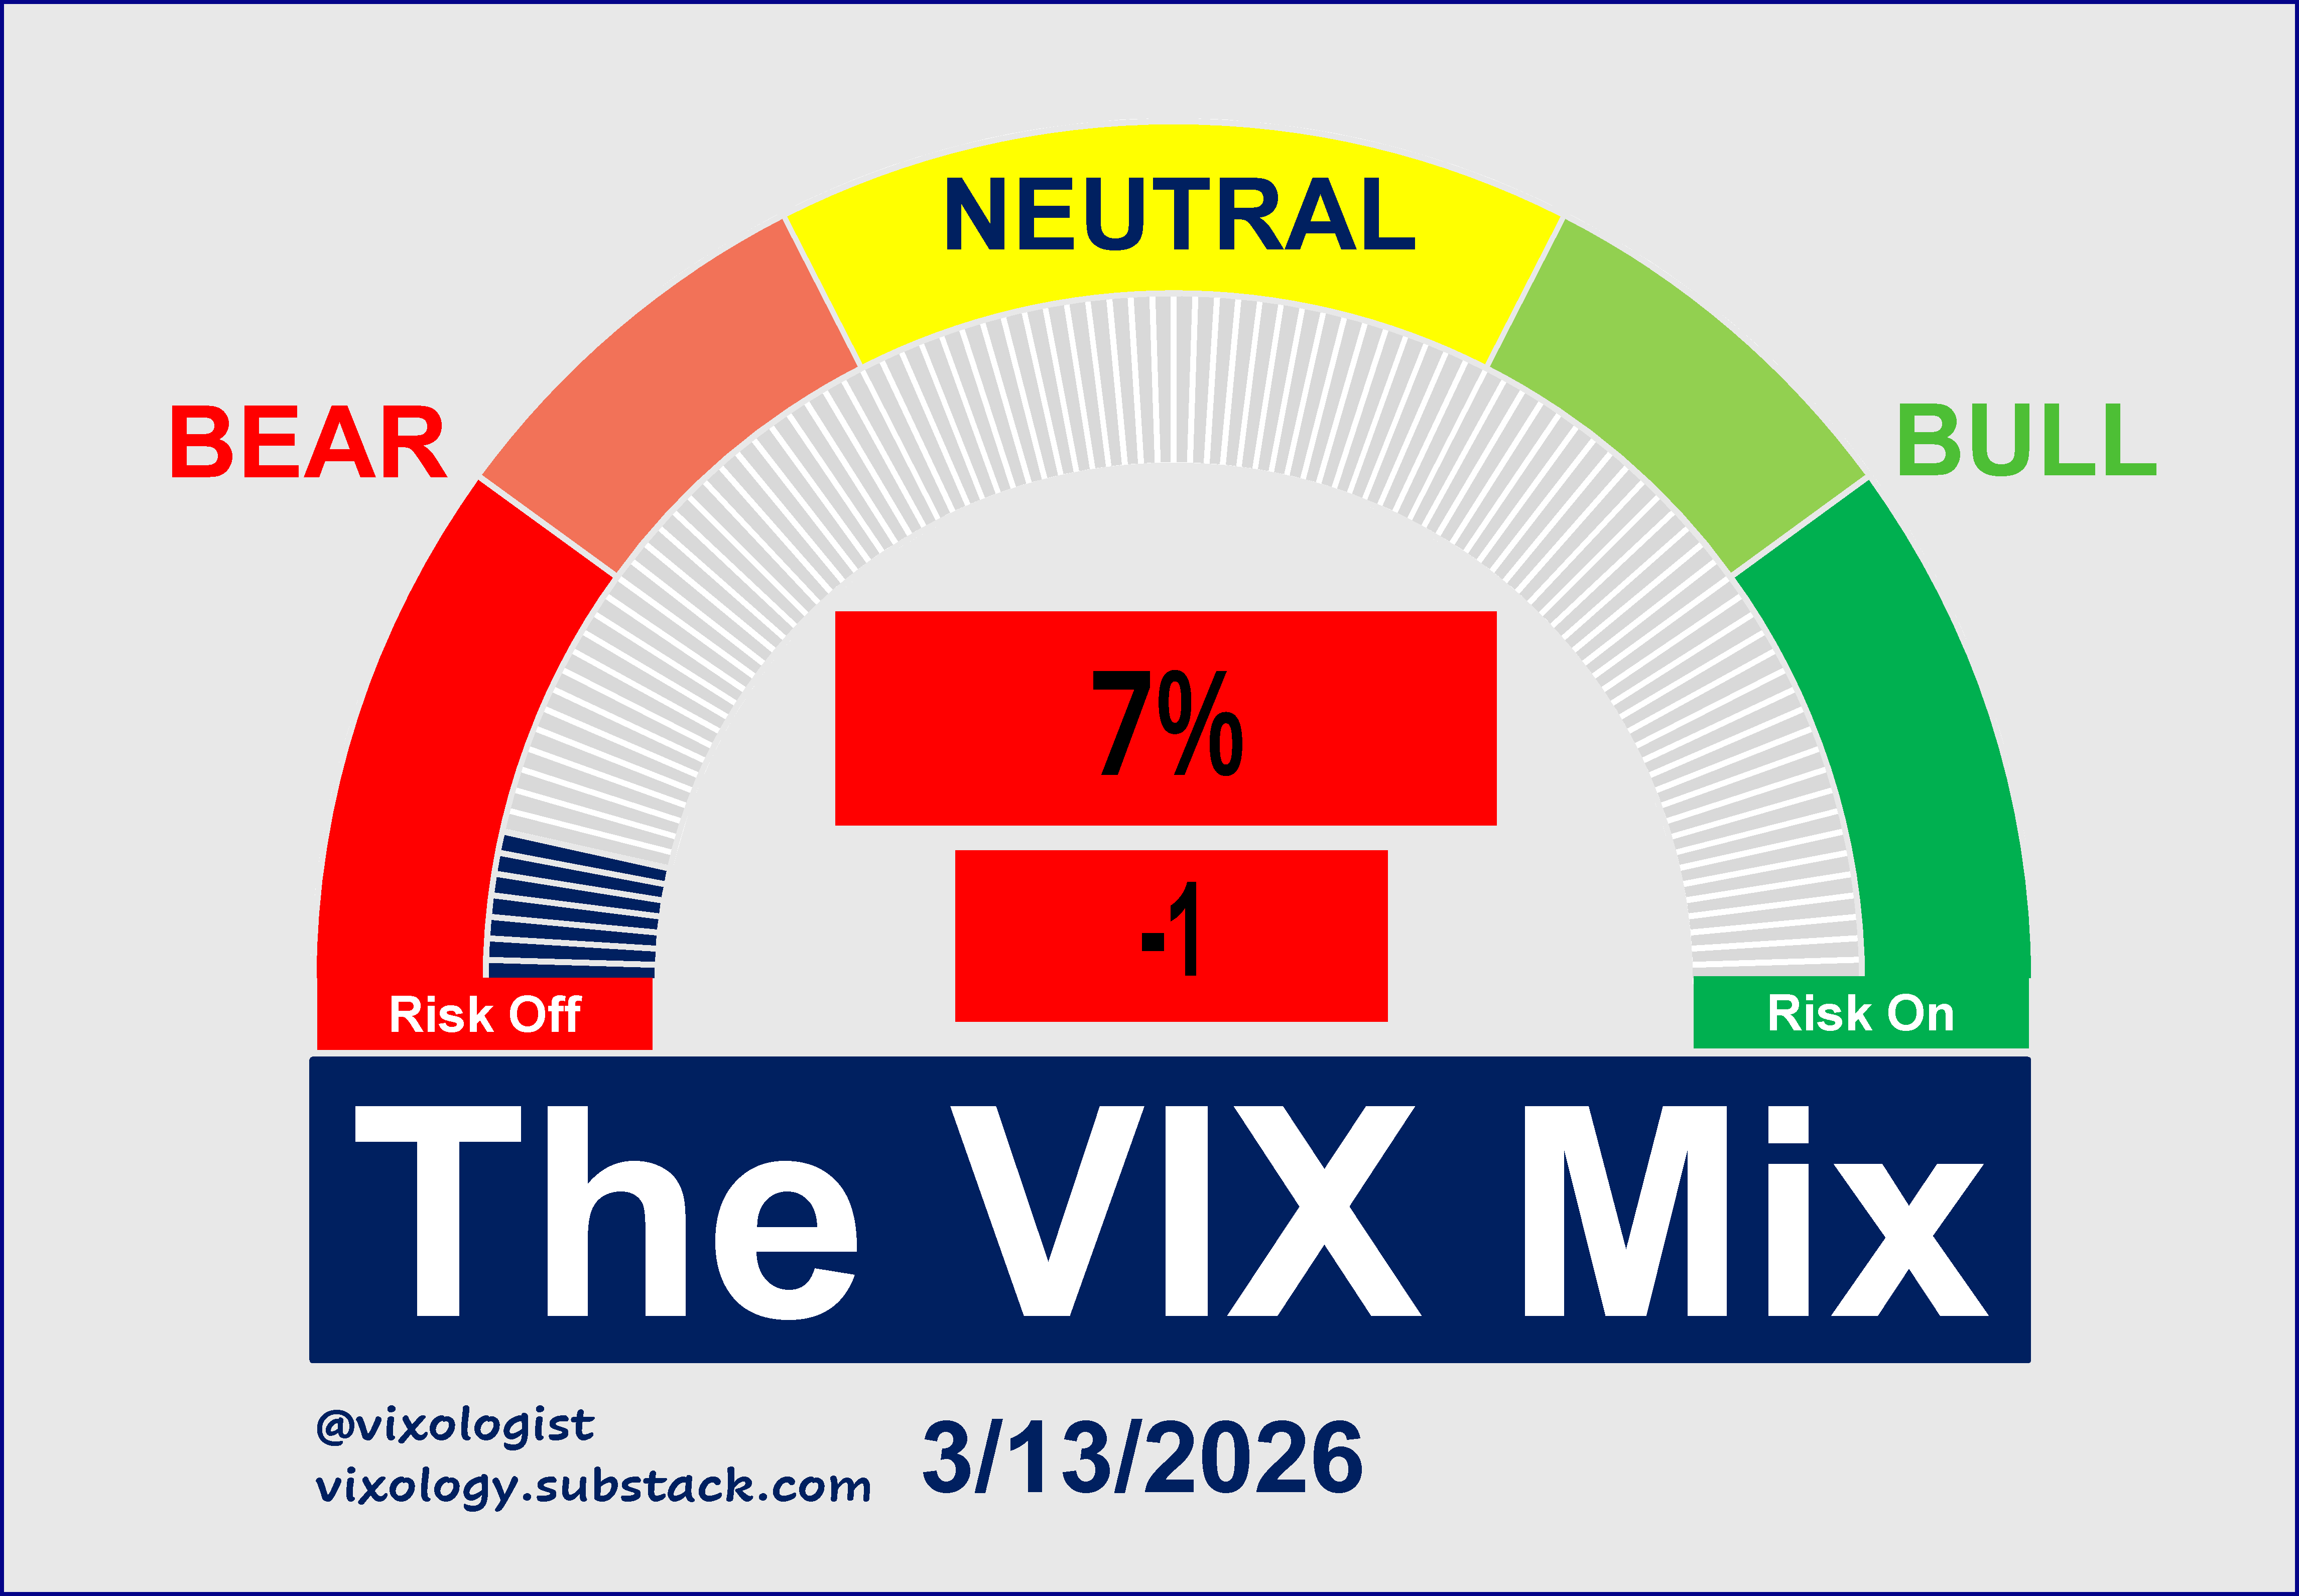
We now have a full two months (42 trading days) since the last bullish reading on the VIX Mix. That’s not even half of the longest streak we’ve seen. That was 99 days from mid-December 2024 through the Tariff Tantrum in 2025. Note that the Mix history goes back only to mid-2012 because some data series don’t go back further than that.
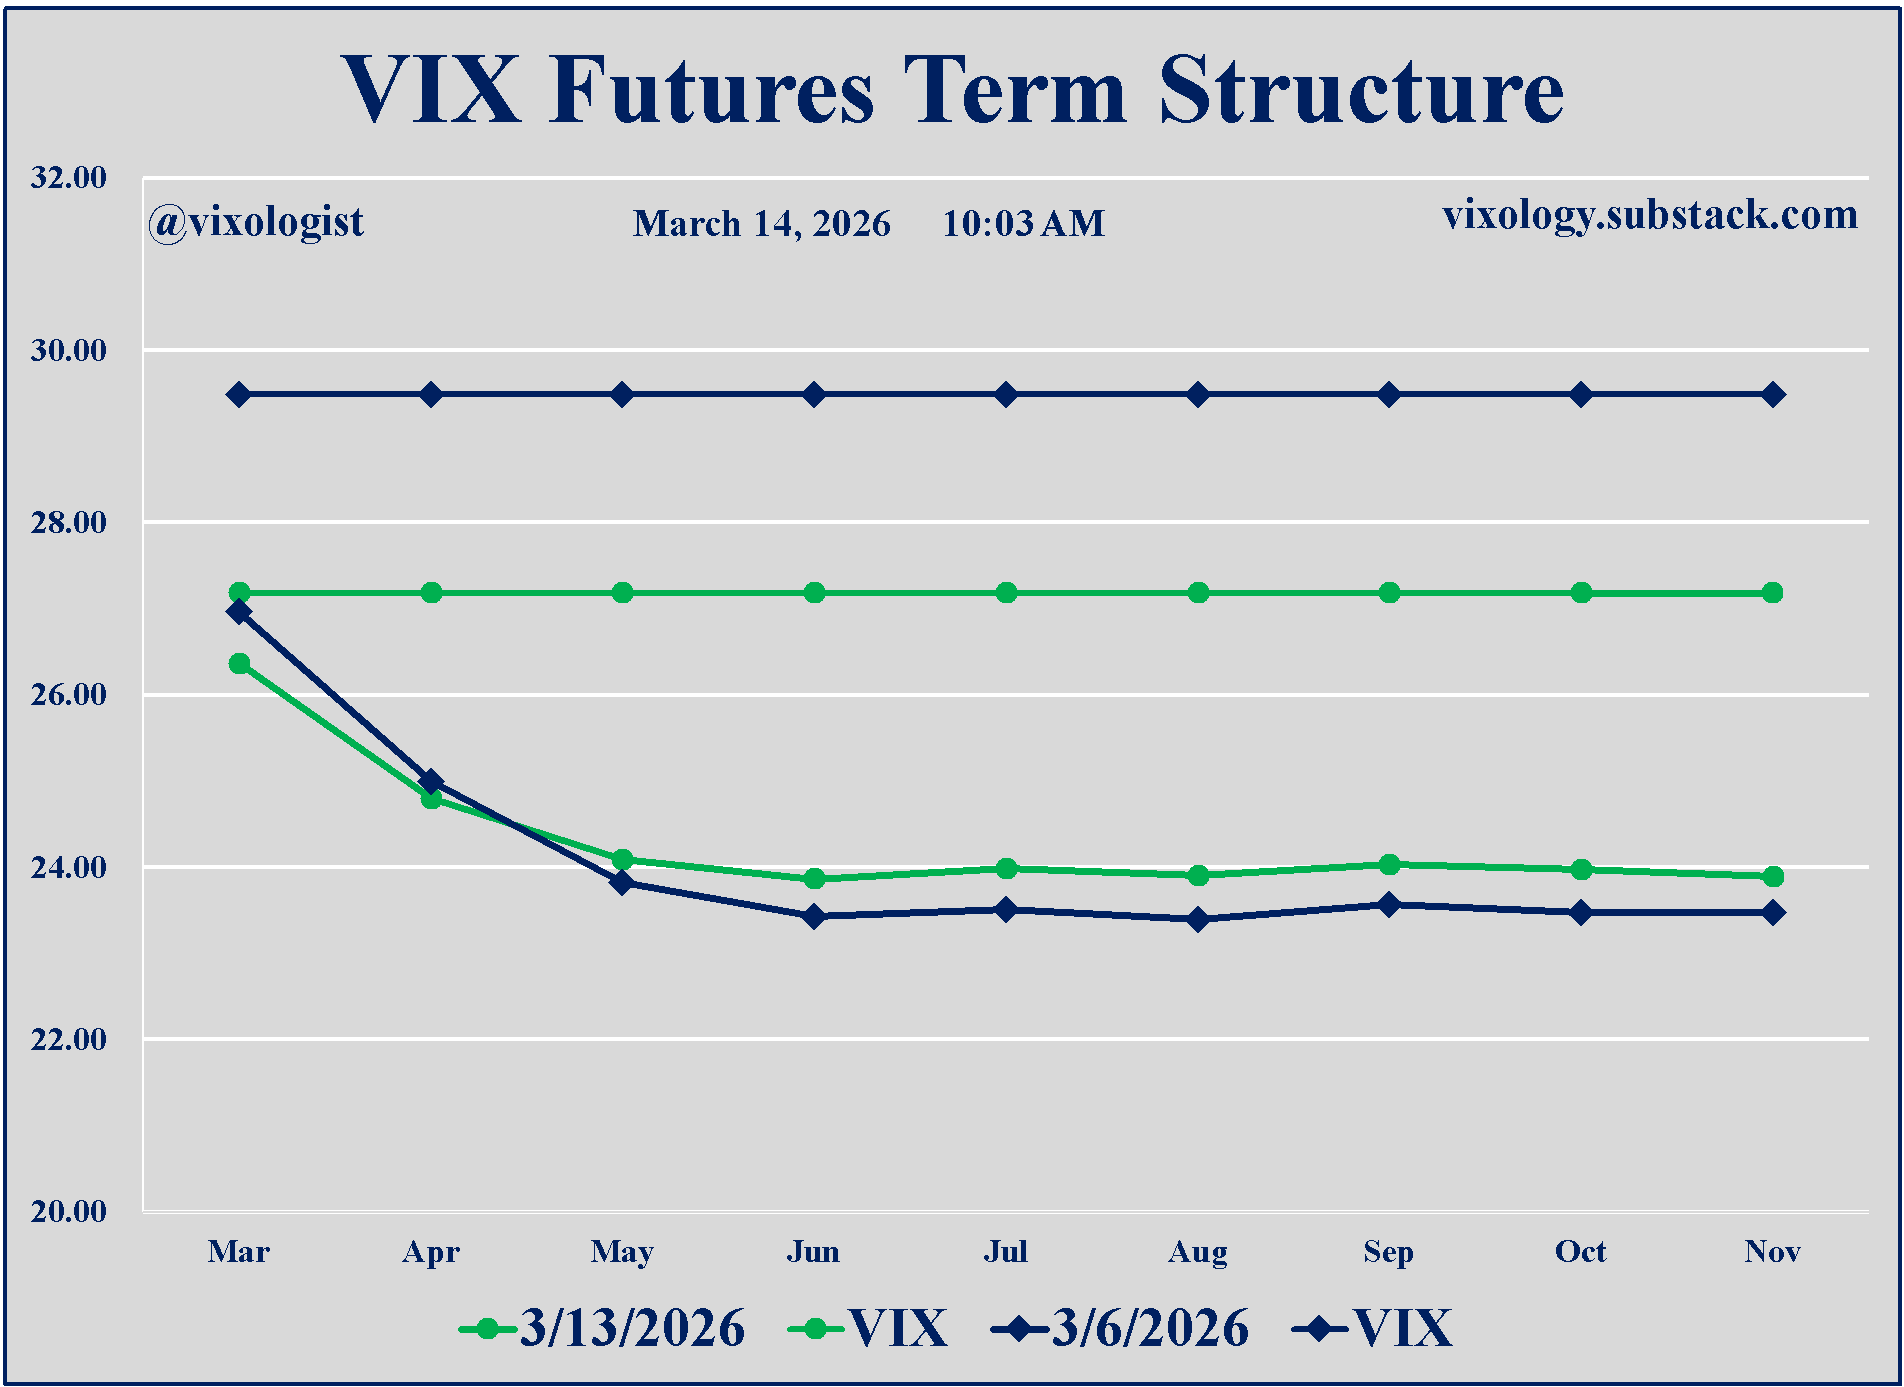
The VIX futures term structure provides some clues to the “confusion” in the land of volatility. As noted above, spot VIX dropped and the futures relaxed a bit at the short end. But it’s important to see that the “curve” actually lifted a bit from May out to November. Also important to keep in mind that the March contract will expire this week and it will track spot VIX very closely on Monday and Tuesday. Finally, spot above the futures is a headwind for the short vol trade even as it may be tempting to put on a reversal trade.
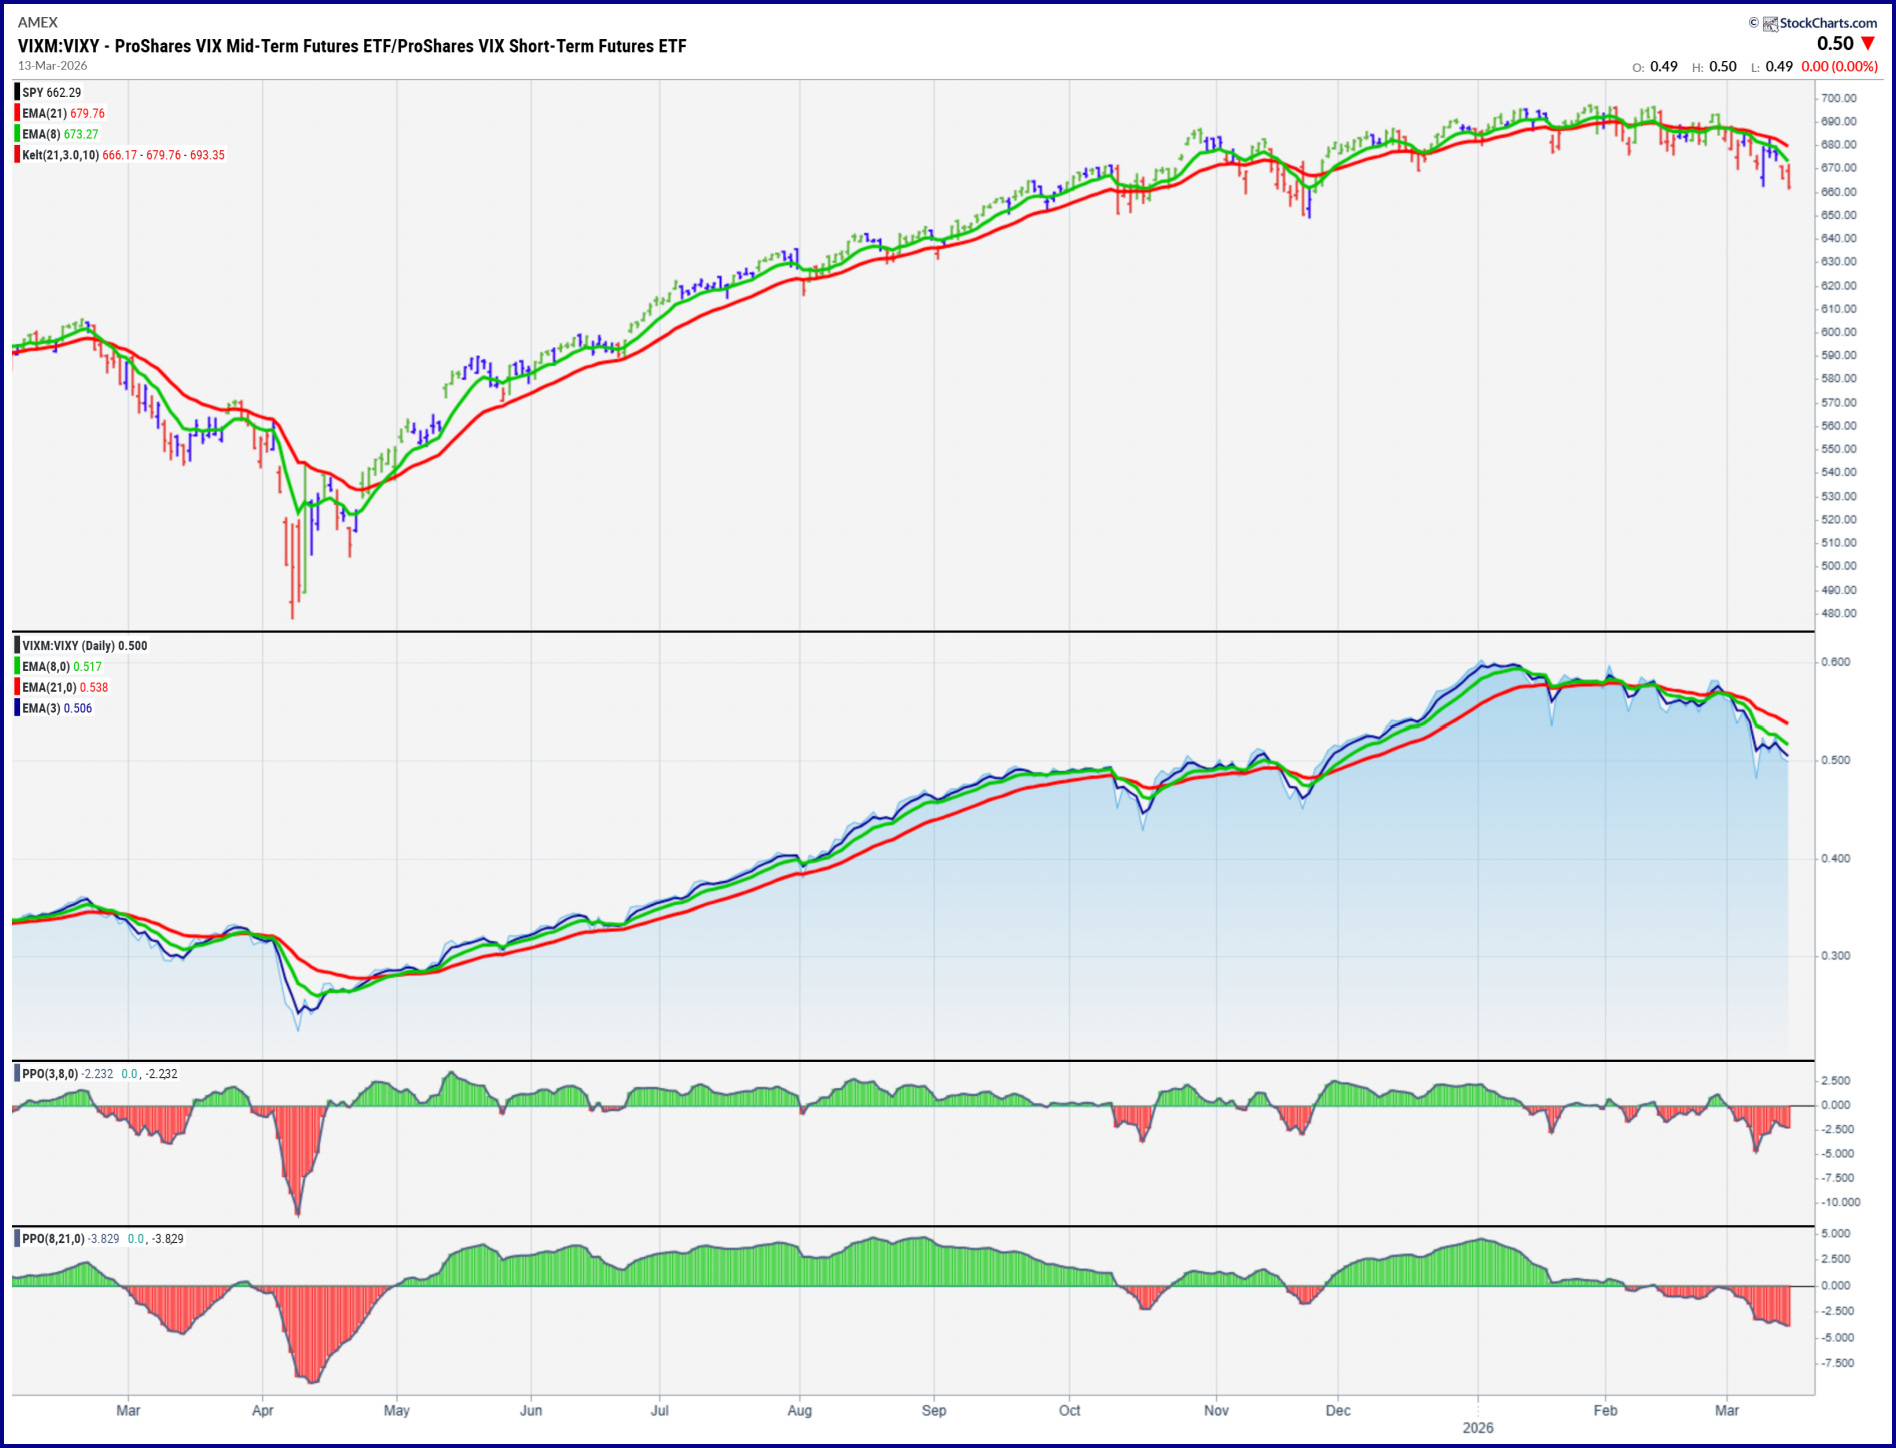
Our other favorite look at the term structure compares VIXM to VIXY. Most subscribers have seen this before. The slower crossover pair (8 and 21-day EMA) went red on Feb 12 and have been that way ever since.
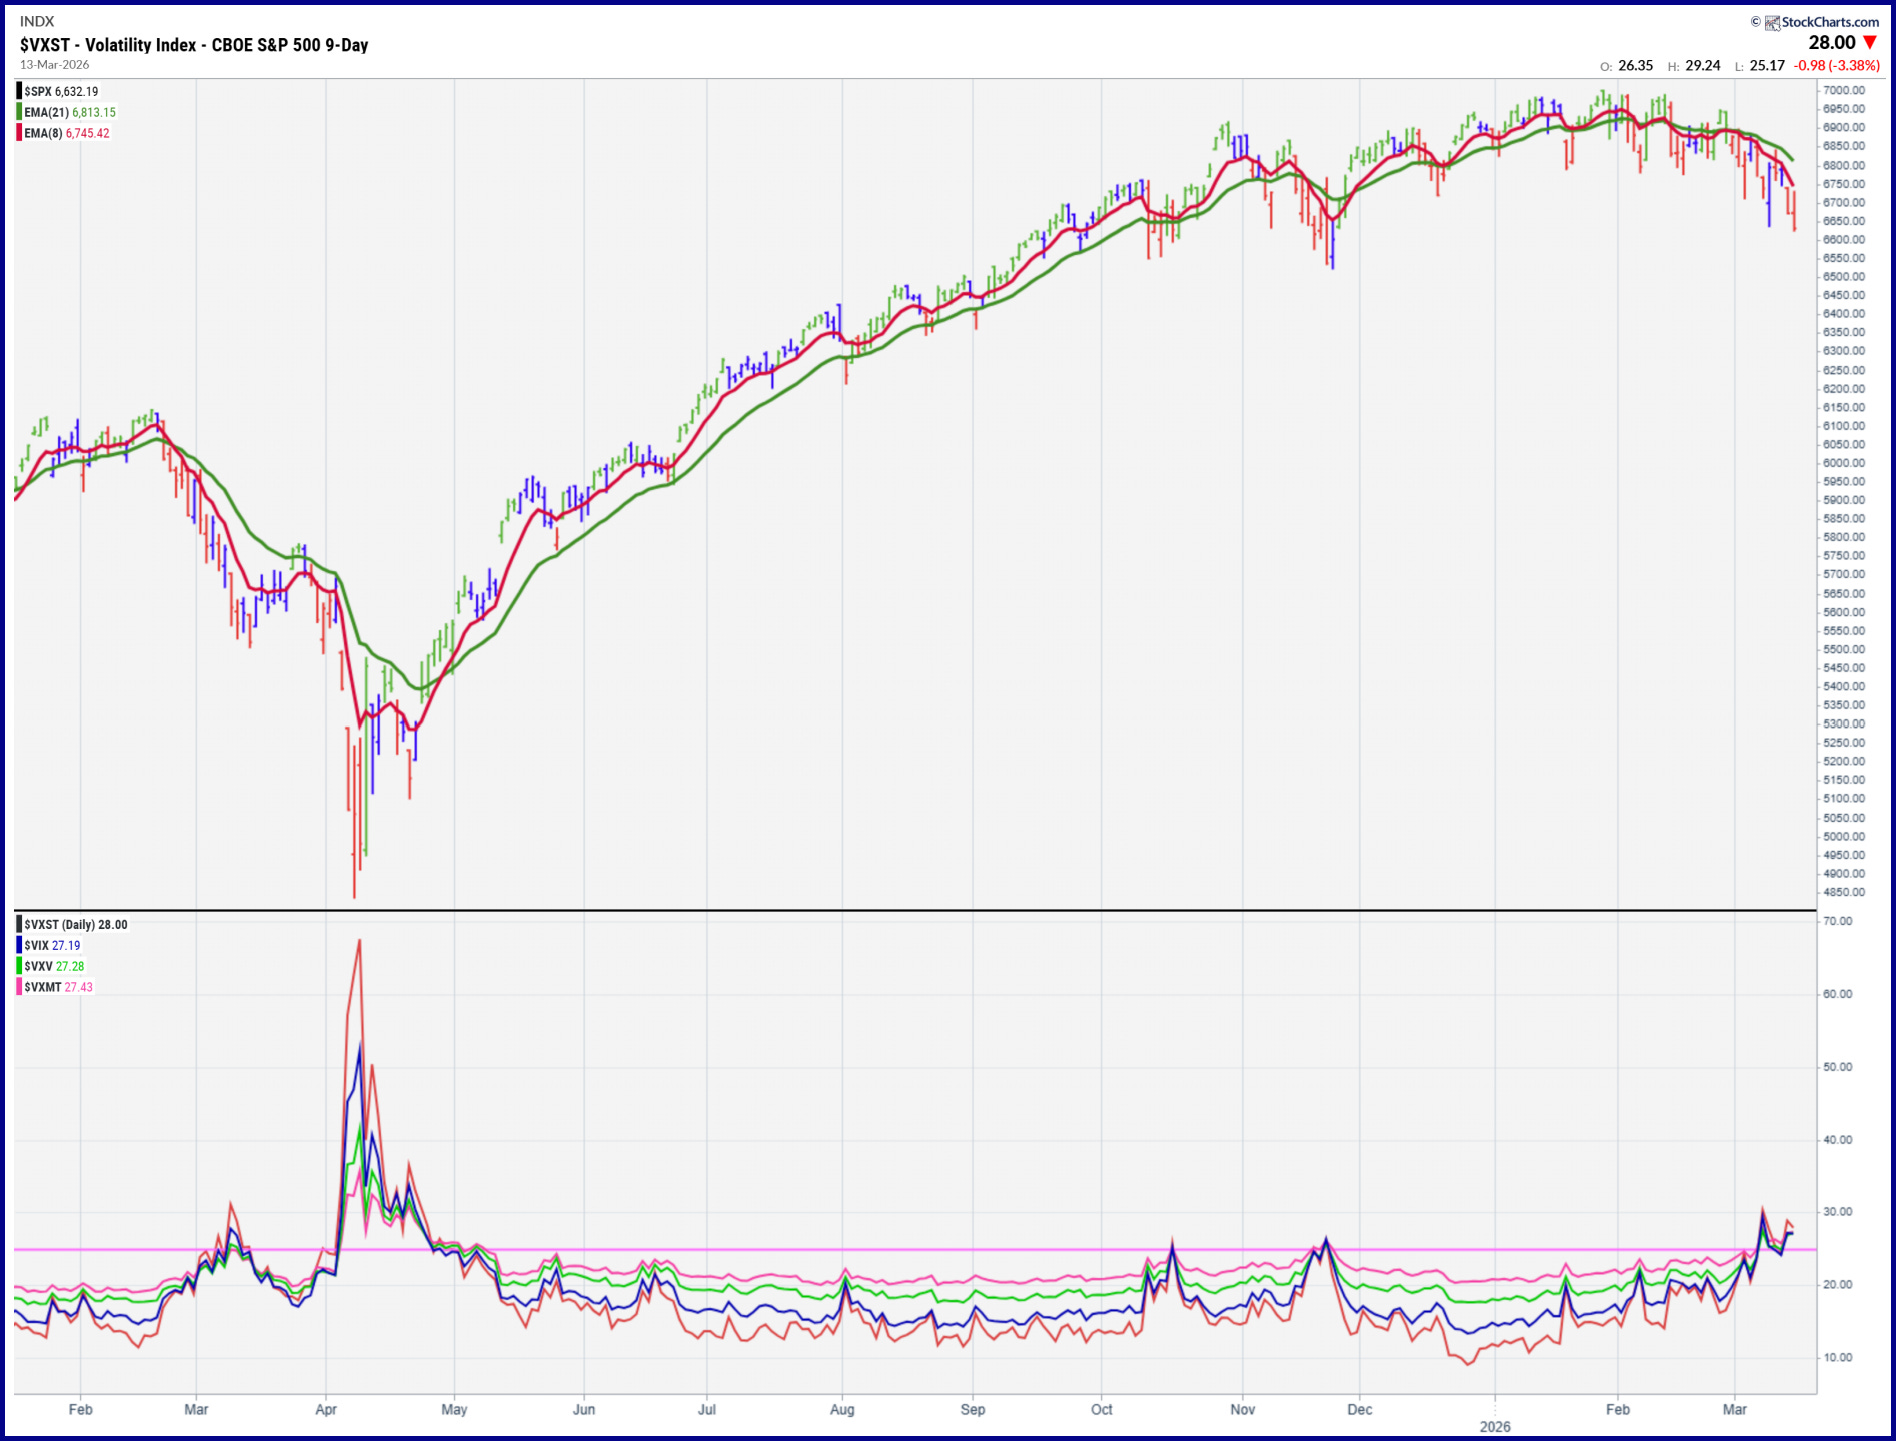
Using the CBOE vol indices, we posted this chart on X/Twitter showing that all four of the primary indices (VIX 9D, VIX, VIX3M and VIX6M) are above 25. Not the usual look and important to recognize that it’s possible to see these go much higher.
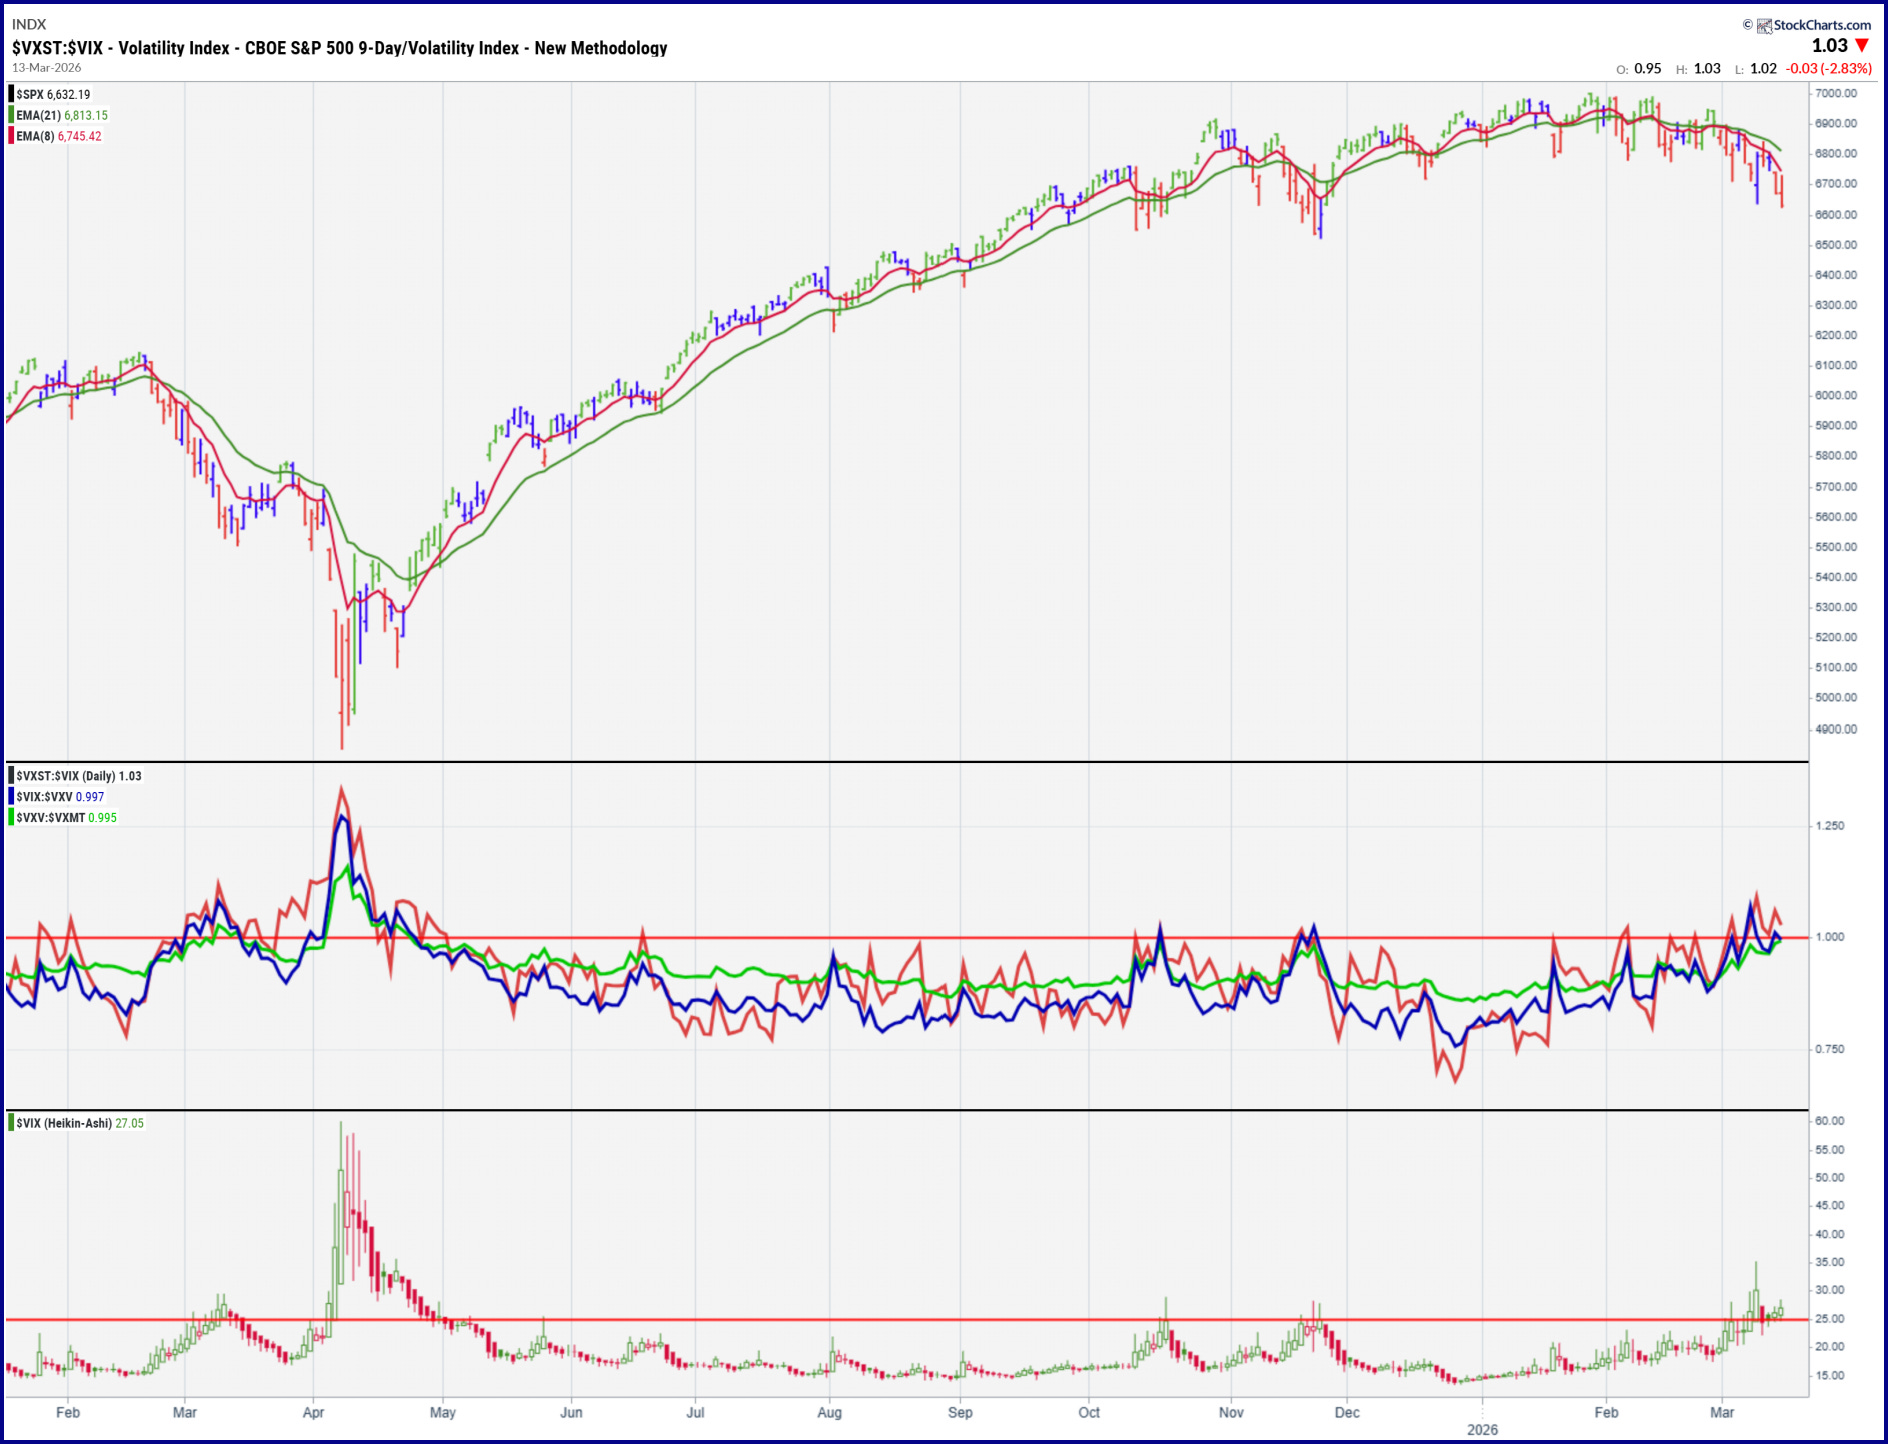
Another way to look at the same data compares the ratios: VIX9D:VIX, VIX:VIX3M and VIX3M:VIX6M. The bright line here is a 1:1 ratio and the trio are all very tight to that level right now. Above 1:1 is bad.
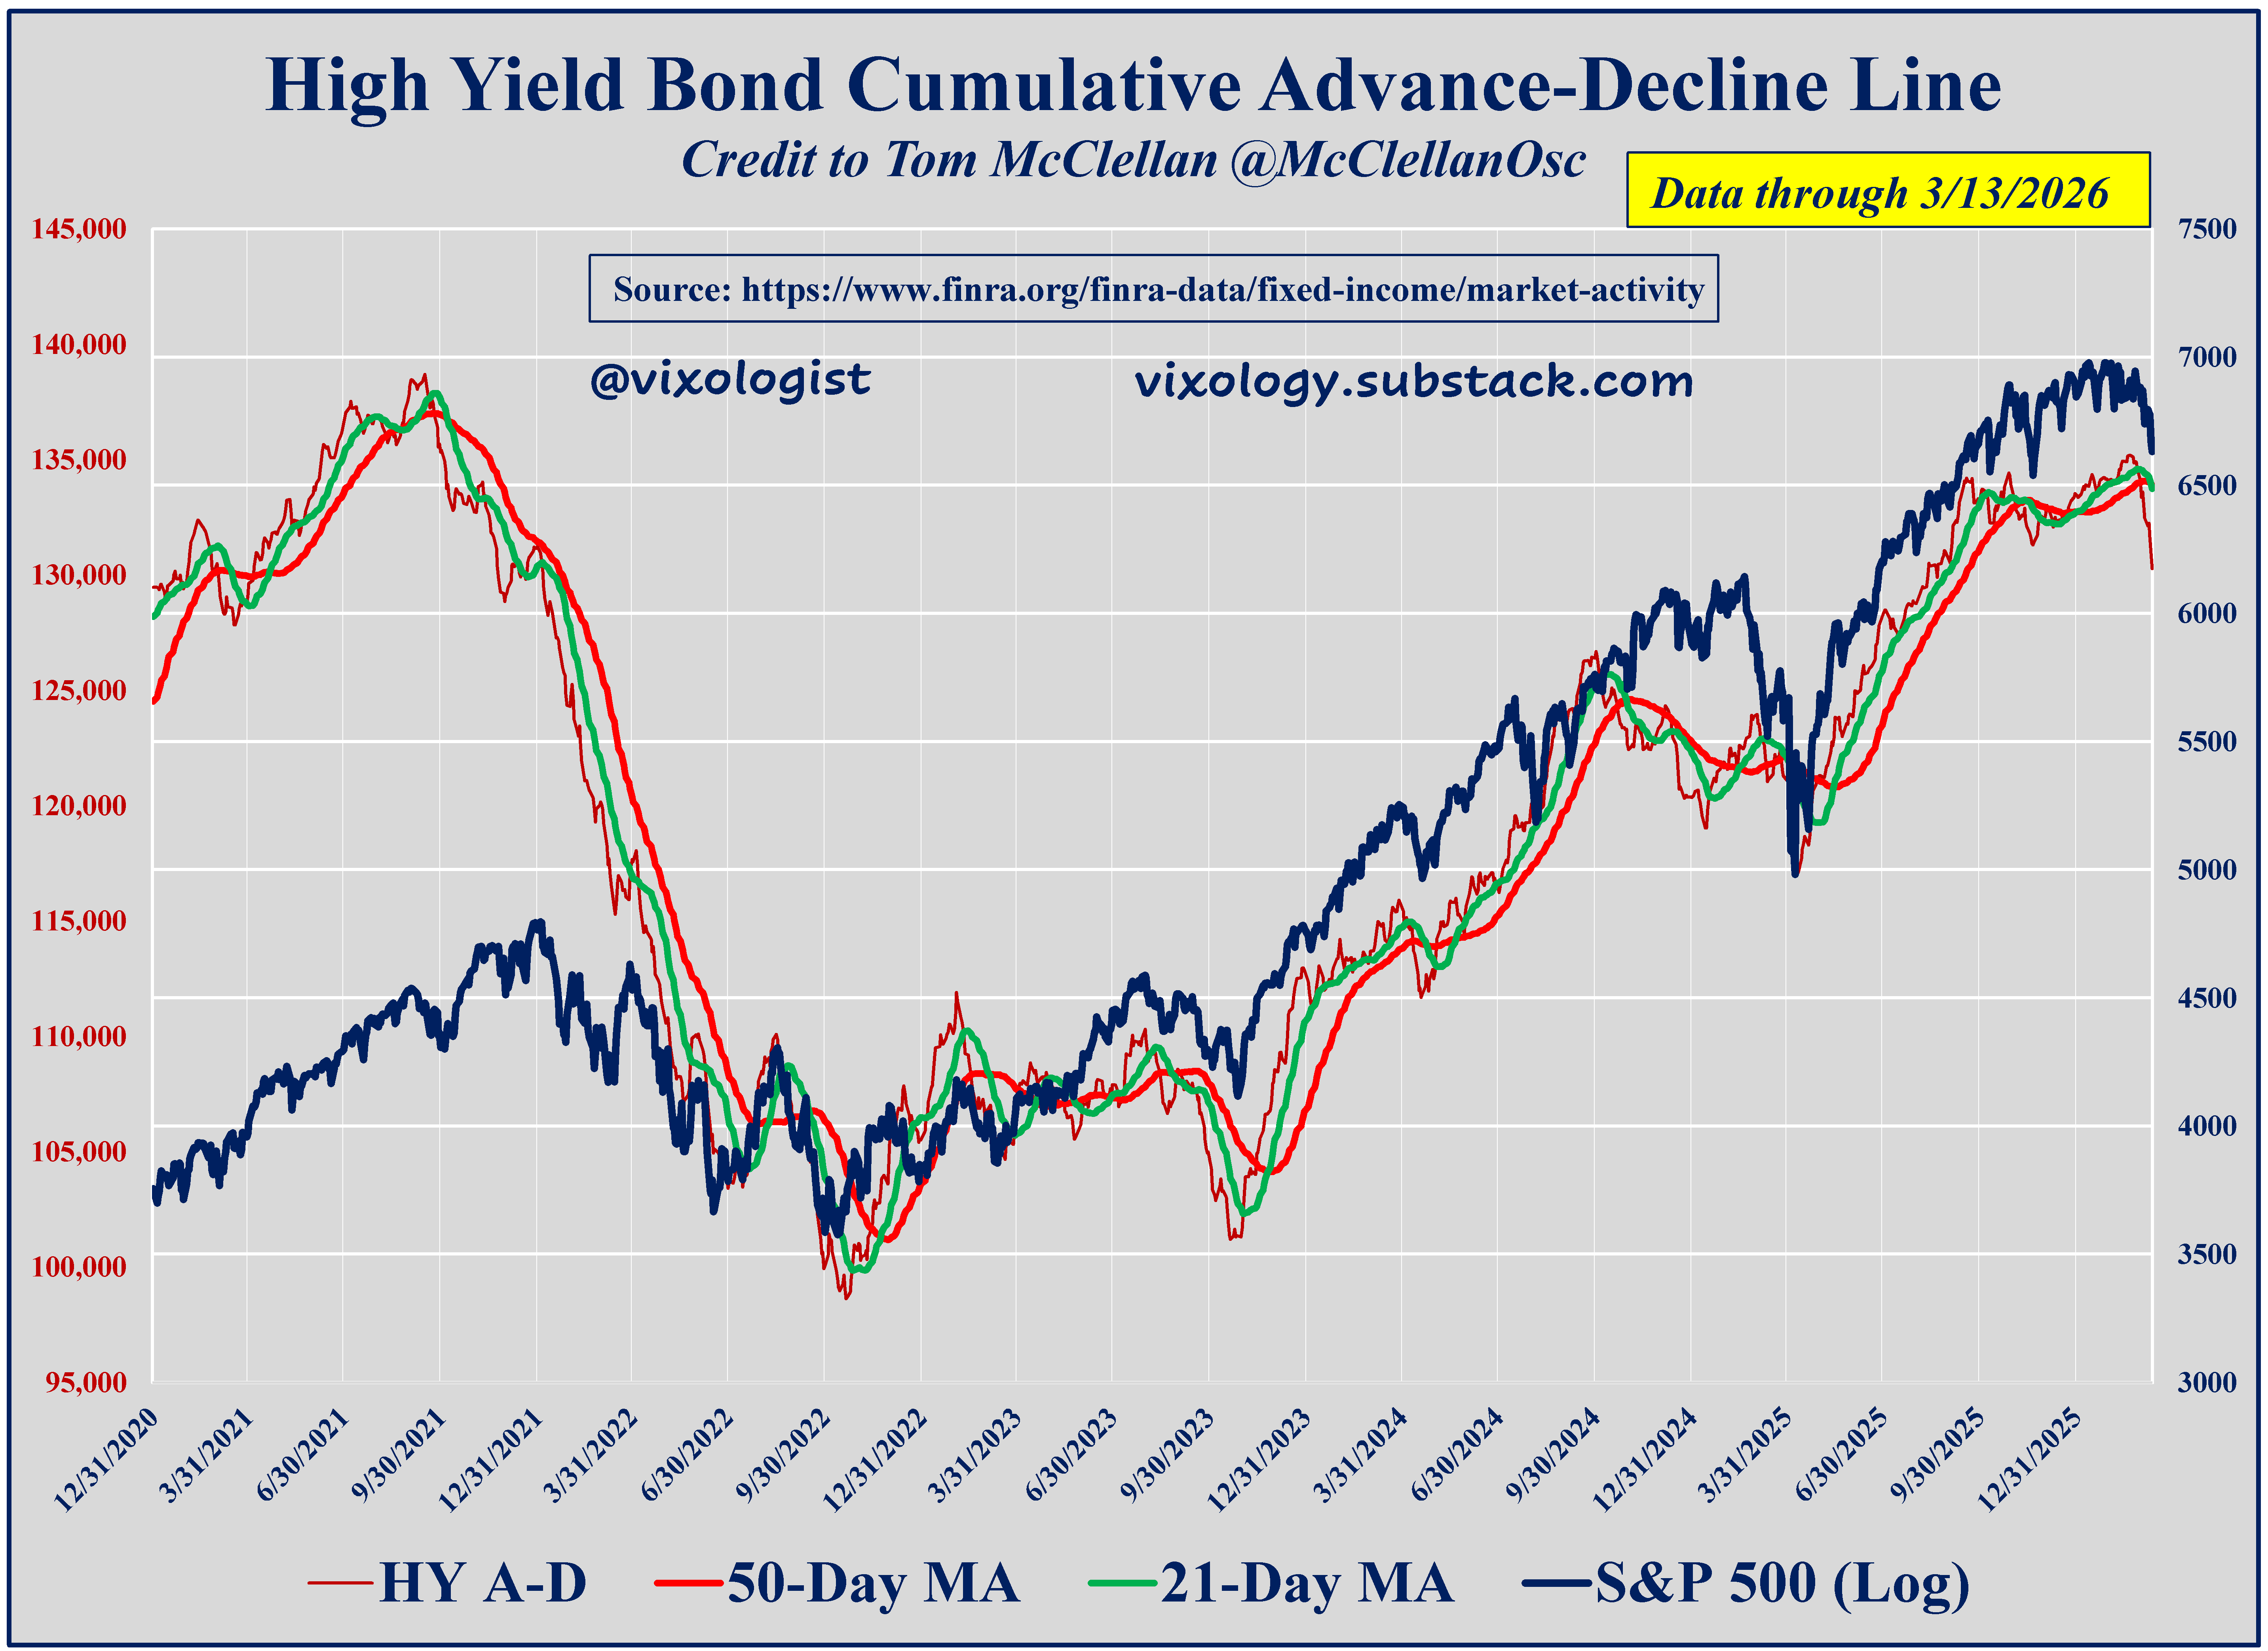
Last but not least, US equities are not the only chart lines that have rolled over. Breadth in the public high yield market (using advance/decline data from FINRA) has turned sour at the same time. You’ve been hearing a lot about cracks in private credit. This is not that, but weakness in the junk market has been a good canary in the coal mine. It will be hard for stocks to resume their uptrend if the HYAD continues to head south.
This week has the potential for more fireworks even without Marines showing up in the Gulf. As mentioned above, VIX positioning will reset Wednesday morning with expiration of the March futures contract. Friday may be an even bigger deal as traders navigate the quarterly OpEx. I choose to leave all that options mishigas to the smart kids, but I’ll be closely watching short-term price behavior among the volatility exchange-traded products that are my chosen trading instruments.
Big picture, I will be surprised to discover that the lows are in for equity markets. We simply have not begun to really see the impact of disruption to the flow of critical commodities that pass through the Straits of Hormuz. The longer it takes, the bigger the impact. And the impact in the US may well pale in comparison to Europe and Asia that are much more dependent on imports of energy and both agricultural and industrial commodities. The clock is ticking.
All content presented here is for informational and educational purposes only. Distribution of any content to any persons other than the recipient is unauthorized. Furthermore, any alteration of content presented here is prohibited. By accepting delivery of this presentation, the reader agrees to the foregoing. Certain information presented herein has been obtained from third-party sources considered to be reliable, but there is no guarantee of completeness or accuracy and it should not be relied upon as such. There is no obligation to update or correct any information presented. Readers should not treat any statement, opinion or viewpoint expressed herein as a solicitation or recommendation to buy or sell any security or follow any investment strategy. This material does not consider the investment objectives, financial situation, or needs of any particular reader. Readers should seek advice from a qualified financial or investment advisor prior to making any investment decision.