
Tempted by the Squeeze
When will the truth be discovered?

Squeeze were a UK band that rose to prominence during the New Wave era of the late ‘70s and early 80’s. Luminaries like Dave Edmonds and Elvis Costello latched on to the lads as producers of several early albums. For today’s edition of Vixology, we are drawn to perhaps their biggest hit, Tempted, that took to the airwaves with their fourth album, East Side Story.
Tempted by the fruit of another, tempted but the truth is discovered.
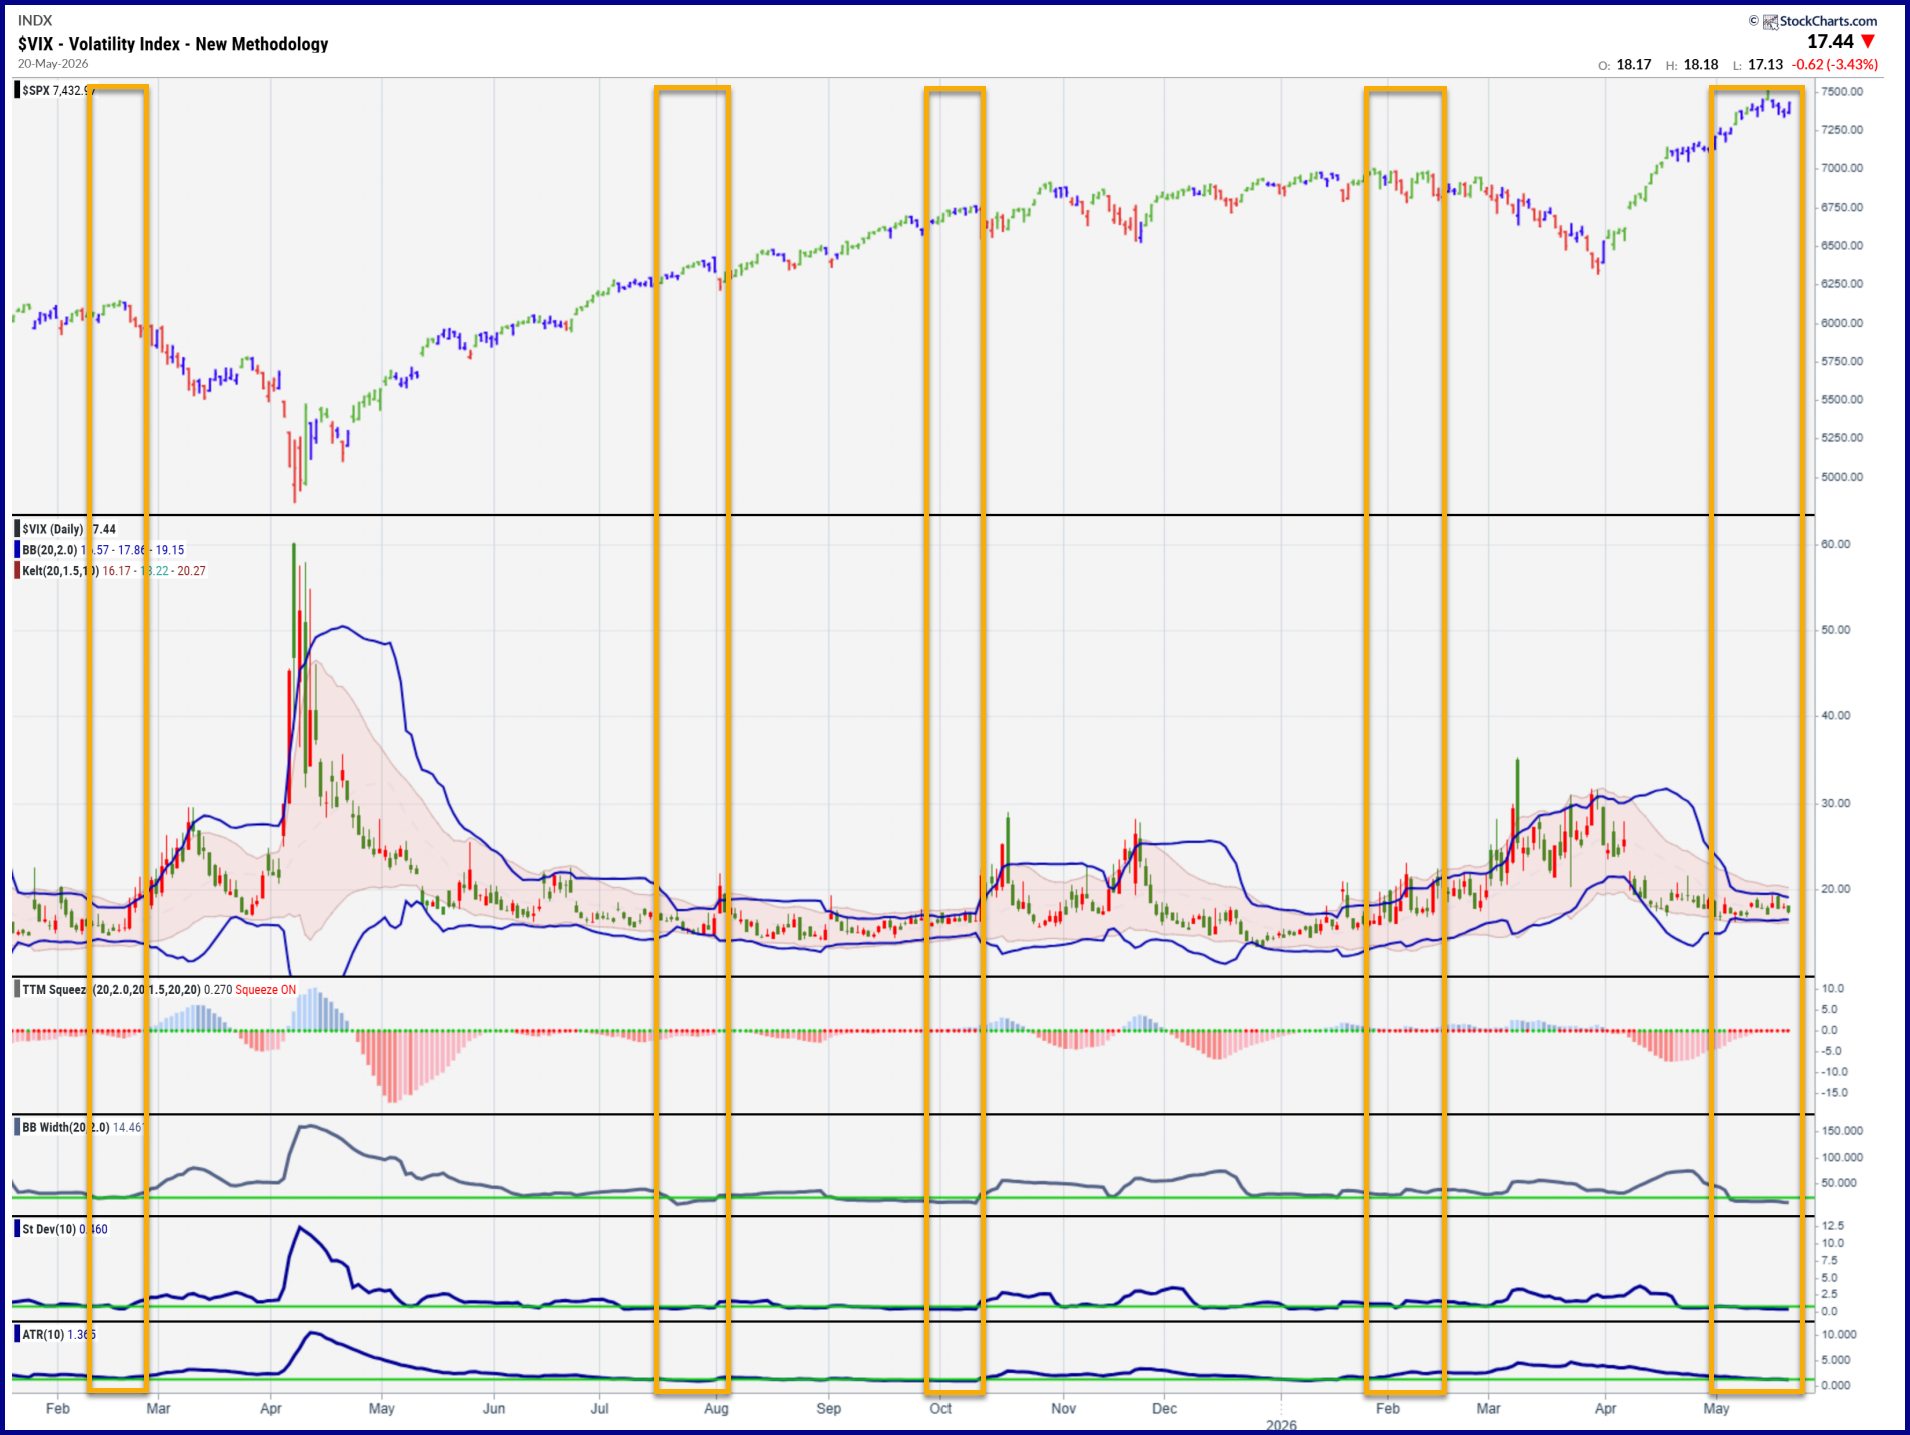
As we scan the volatility complex, it’s hard to resist the temptation that has been emanating from the VIX itself. From time to time, markets get quiet. A trend is in place and day-to-day price changes get smaller. Trading ranges compress as measured by standard deviation, average true range, Bollinger Bands and Keltner Channels. Sometimes these “squeezes” are brief and other times they can extend for weeks. As shown below, we are currently in what has become a very tight squeeze. Using the width of the Bollinger Bands, we sit at the 3rd percentile of history going back to the dawn of VIX in the 90’s.
The chart also shows that these squeezes often resolve in some resurgence of volatility. Sometimes it’s a blip (July of last year), sometimes it’s a surge (February into March of this year), and sometimes it’s a sharp move higher that can lead to a blowoff spike (Feb to Apr 2025 and July/August 2024 not shown on this chart).
So the presence of little red dots on the chart of VIX may produce temptation to go long vol or short equities. Just keep in mind what we said up above: this market condition can persist longer than you might like and shake you out of that long vol/short stocks position. Should you be tempted, simply think about how you might construct a position that you may need to hold for a while.
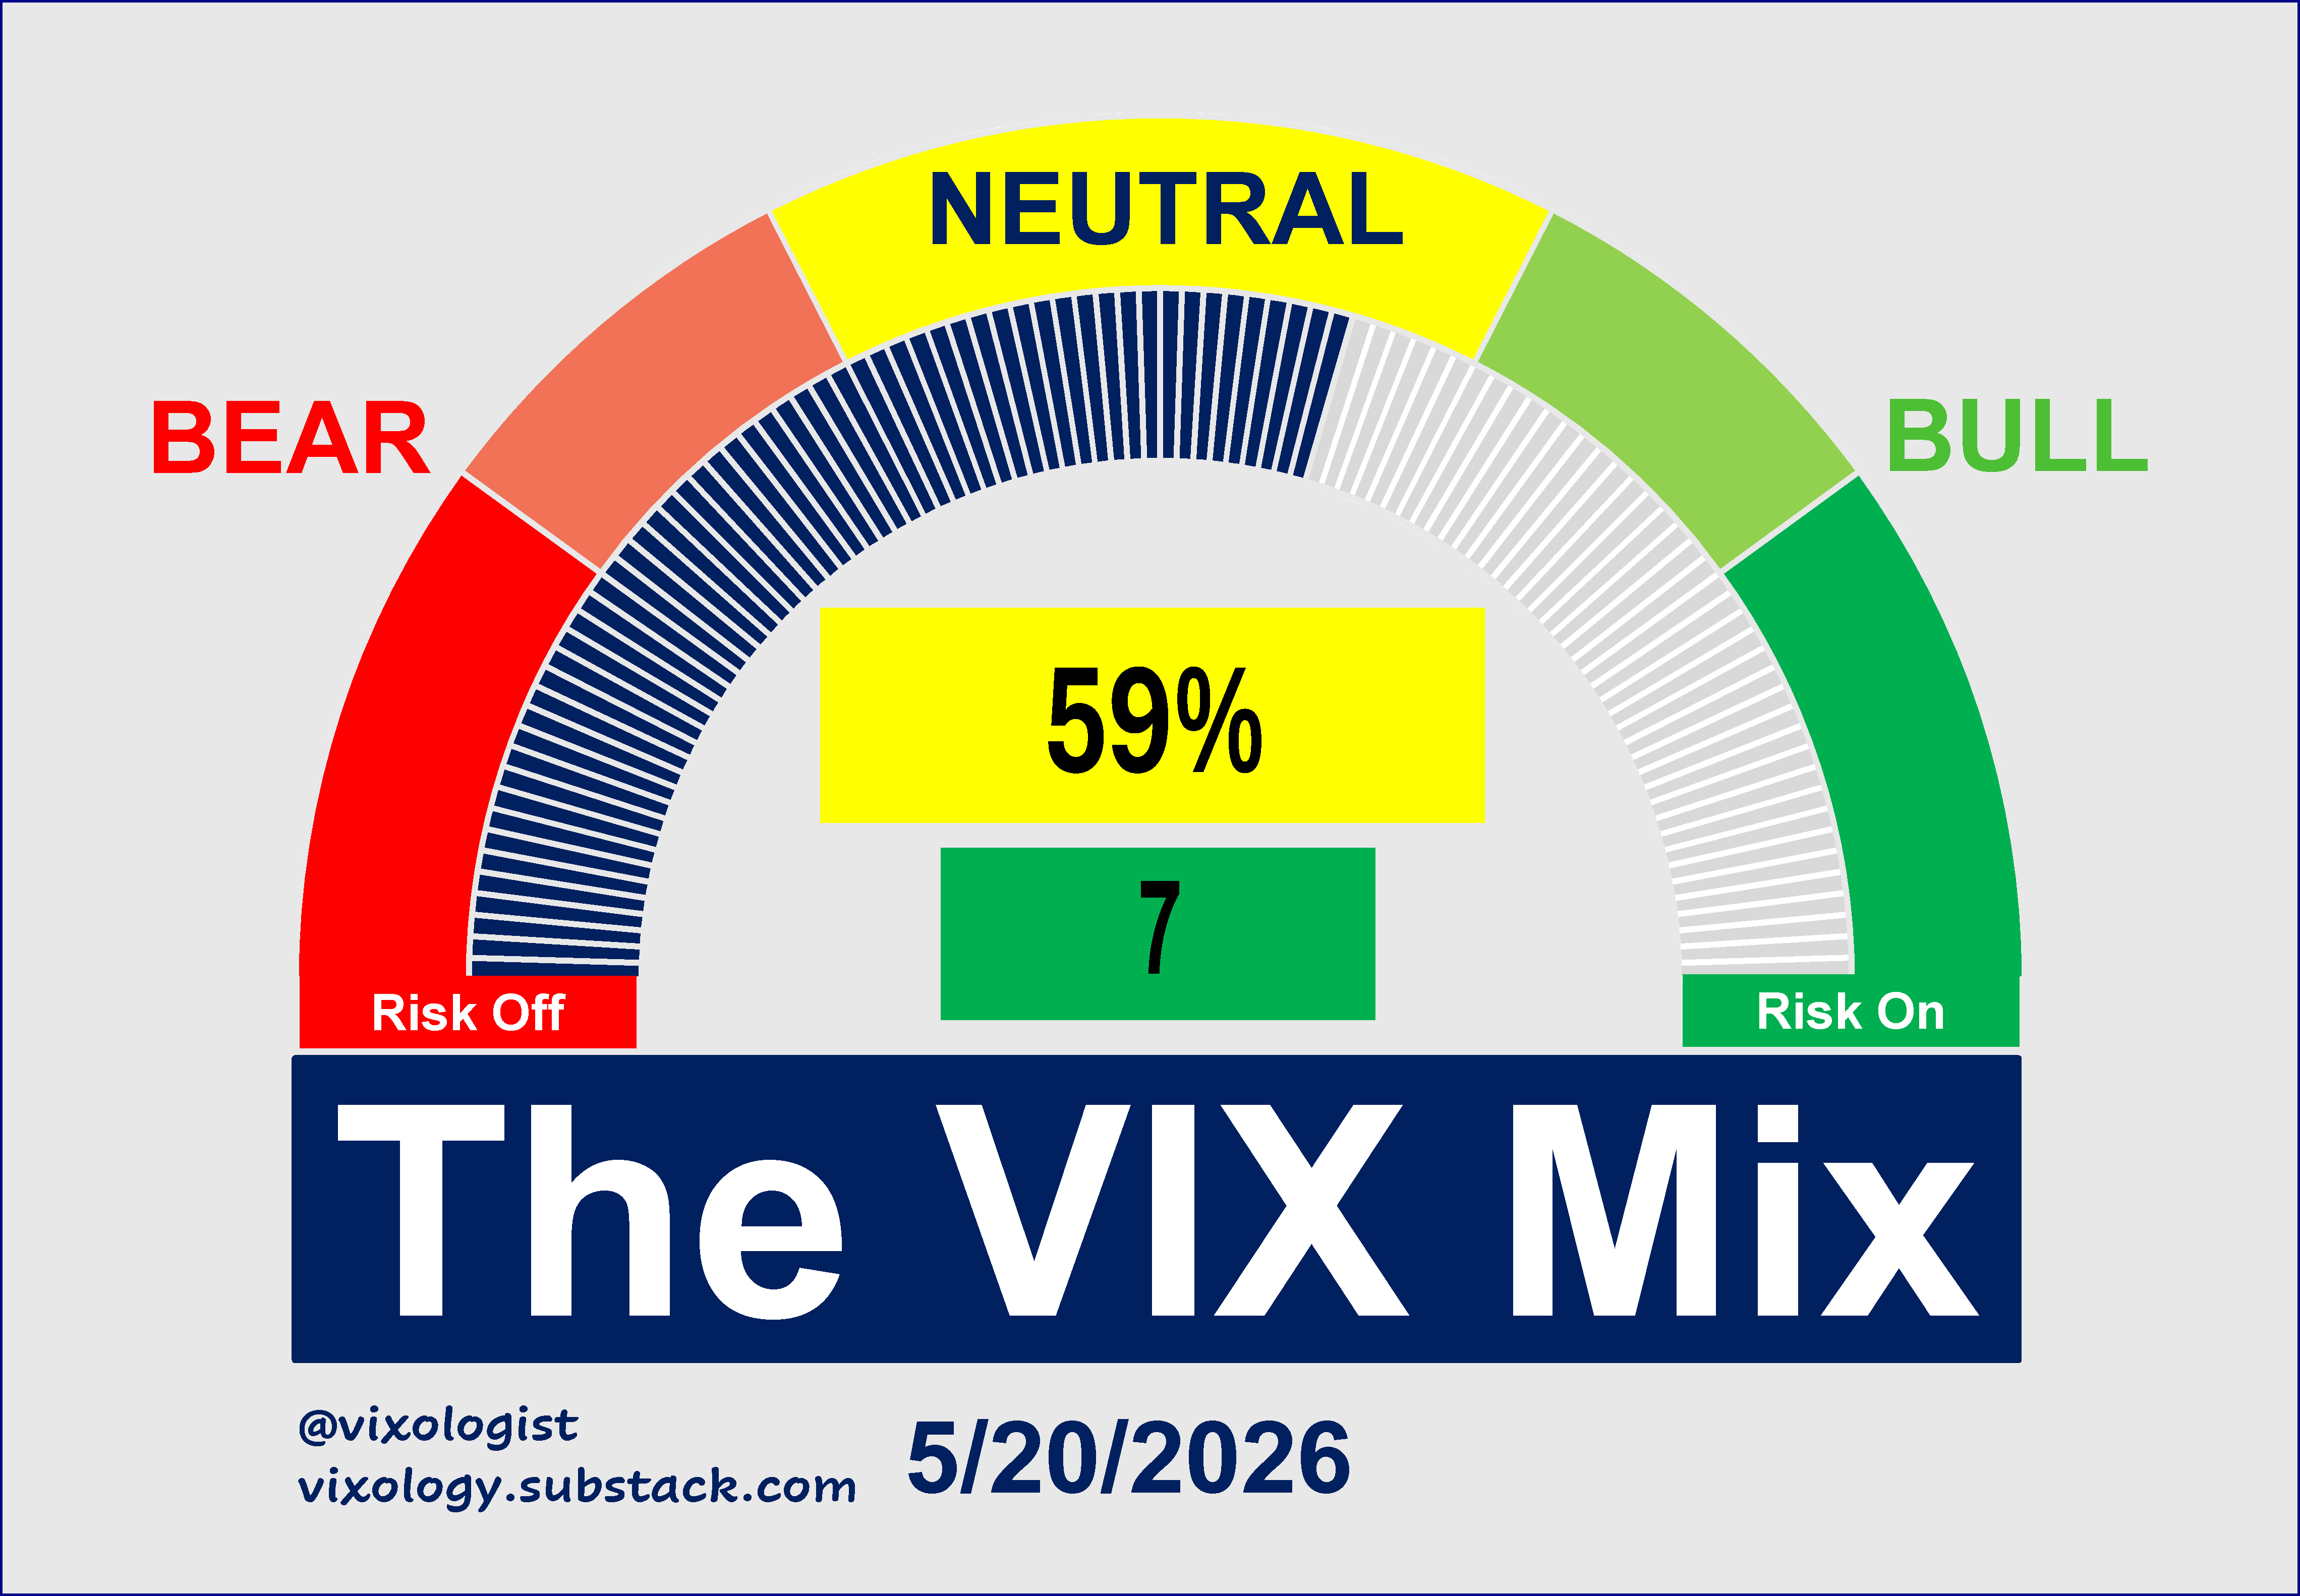
As you think about that, here’s the latest snapshot of the VIX Mix. Yesterday’s equity market rebound allowed the Mix to recover seven points and move back closer to the green bands. 12 of 17 components remain in the neutral zone with five bullish and only one bearish (yes, it’s VIX-VOLI).
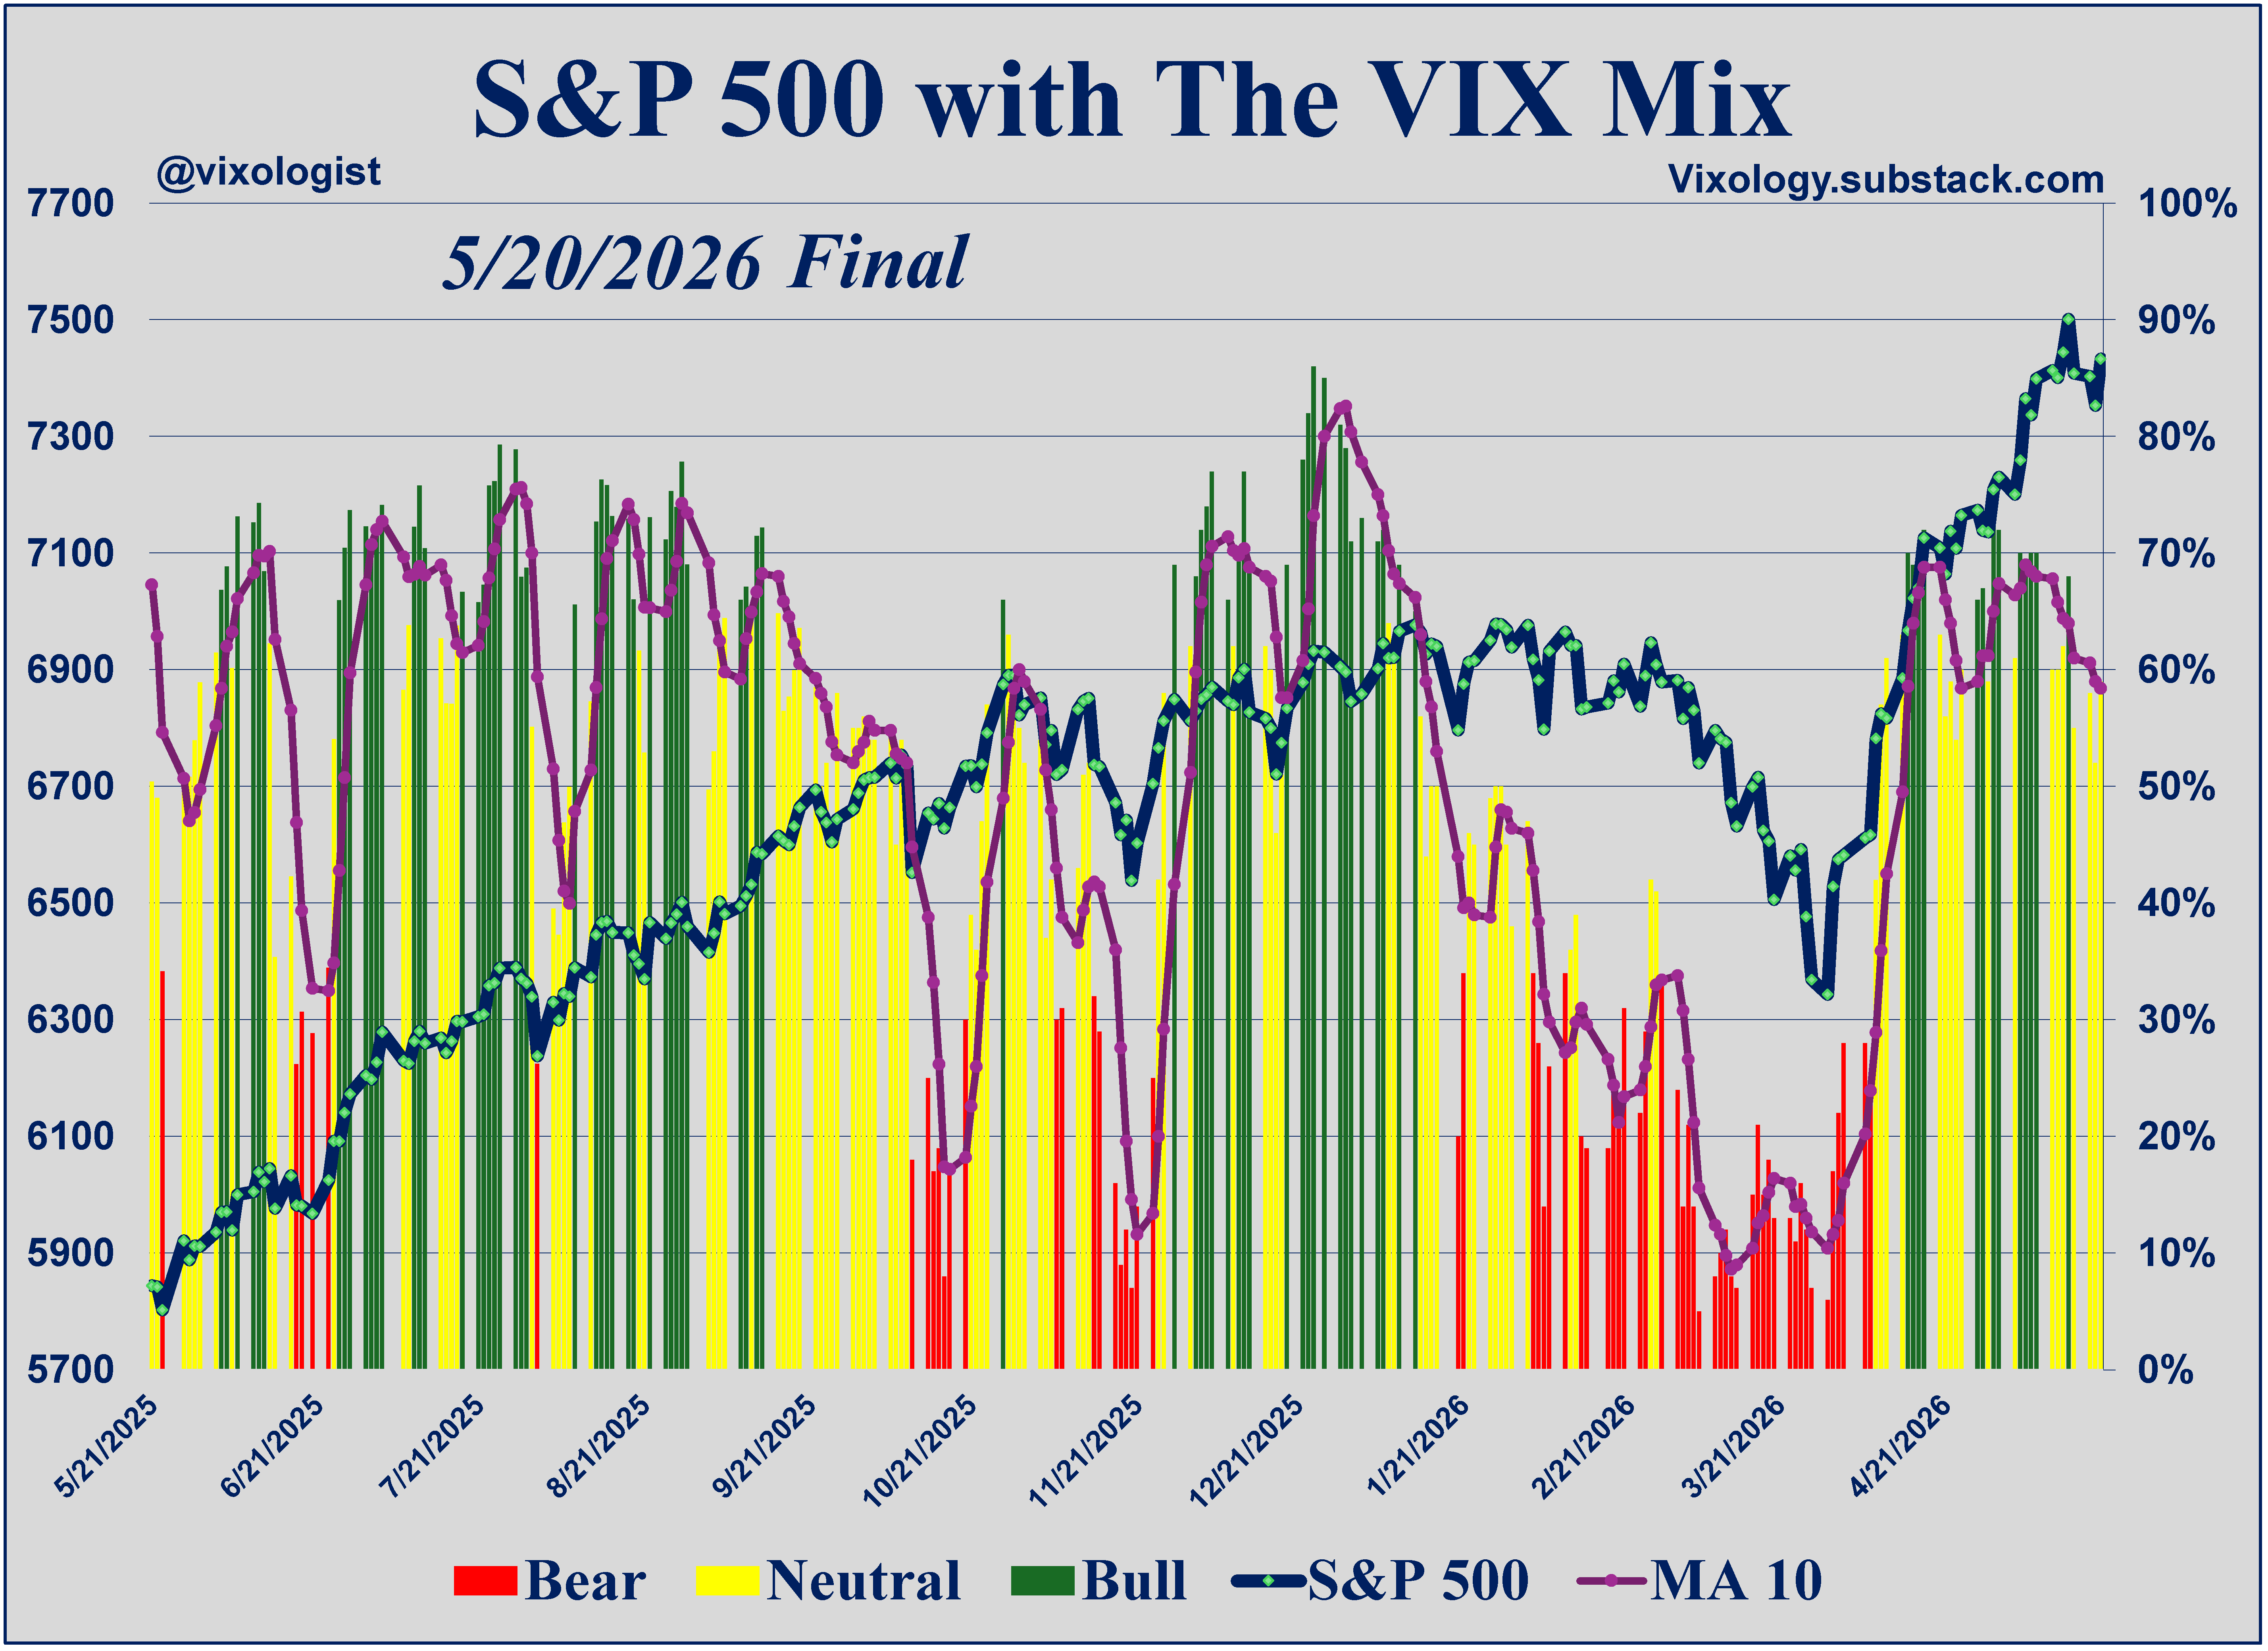
The trend for the Mix is still not a friend as the 10-day moving average continues to point south. You could view this as supportive of that long vol/short stocks idea.
As I push the button on this post, equity futures are trying to give back some of yesterday’s gains with bond yields nudging higher again after taking a day off. VIX is showing 17.67, not much changed from yesterday. Another quiet day will take that Bollinger Bandwidth calculation even lower and put us one day closer to finding out if the squeeze will produce some juice. Will you be happy if it does?
All content presented here is for informational and educational purposes only. Distribution of any content to any persons other than the recipient is unauthorized. Furthermore, any alteration of content presented here is prohibited. By accepting delivery of this presentation, the reader agrees to the foregoing. Certain information presented herein has been obtained from third-party sources considered to be reliable, but there is no guarantee of completeness or accuracy and it should not be relied upon as such. There is no obligation to update or correct any information presented. Readers should not treat any statement, opinion or viewpoint expressed herein as a solicitation or recommendation to buy or sell any security or follow any investment strategy. This material does not consider the investment objectives, financial situation, or needs of any particular reader. Readers should seek advice from a qualified financial or investment advisor prior to making any investment decision.
So many great songs... Cool for Cats, Up The Junction, Take Me I'm Yours, Wrong Side of the Moon... they don't make them like this any more.
I find it easier to play the mean reversion after a vol event a la Listman. Problem with long vol is being at the computer when it actually happens in order to profit from the position.
By my measure, 30-day realized vol of the VIX is sitting at ~70%, which is in the ~7th percentile on a one year lookback.