
Less Bad
But not yet good

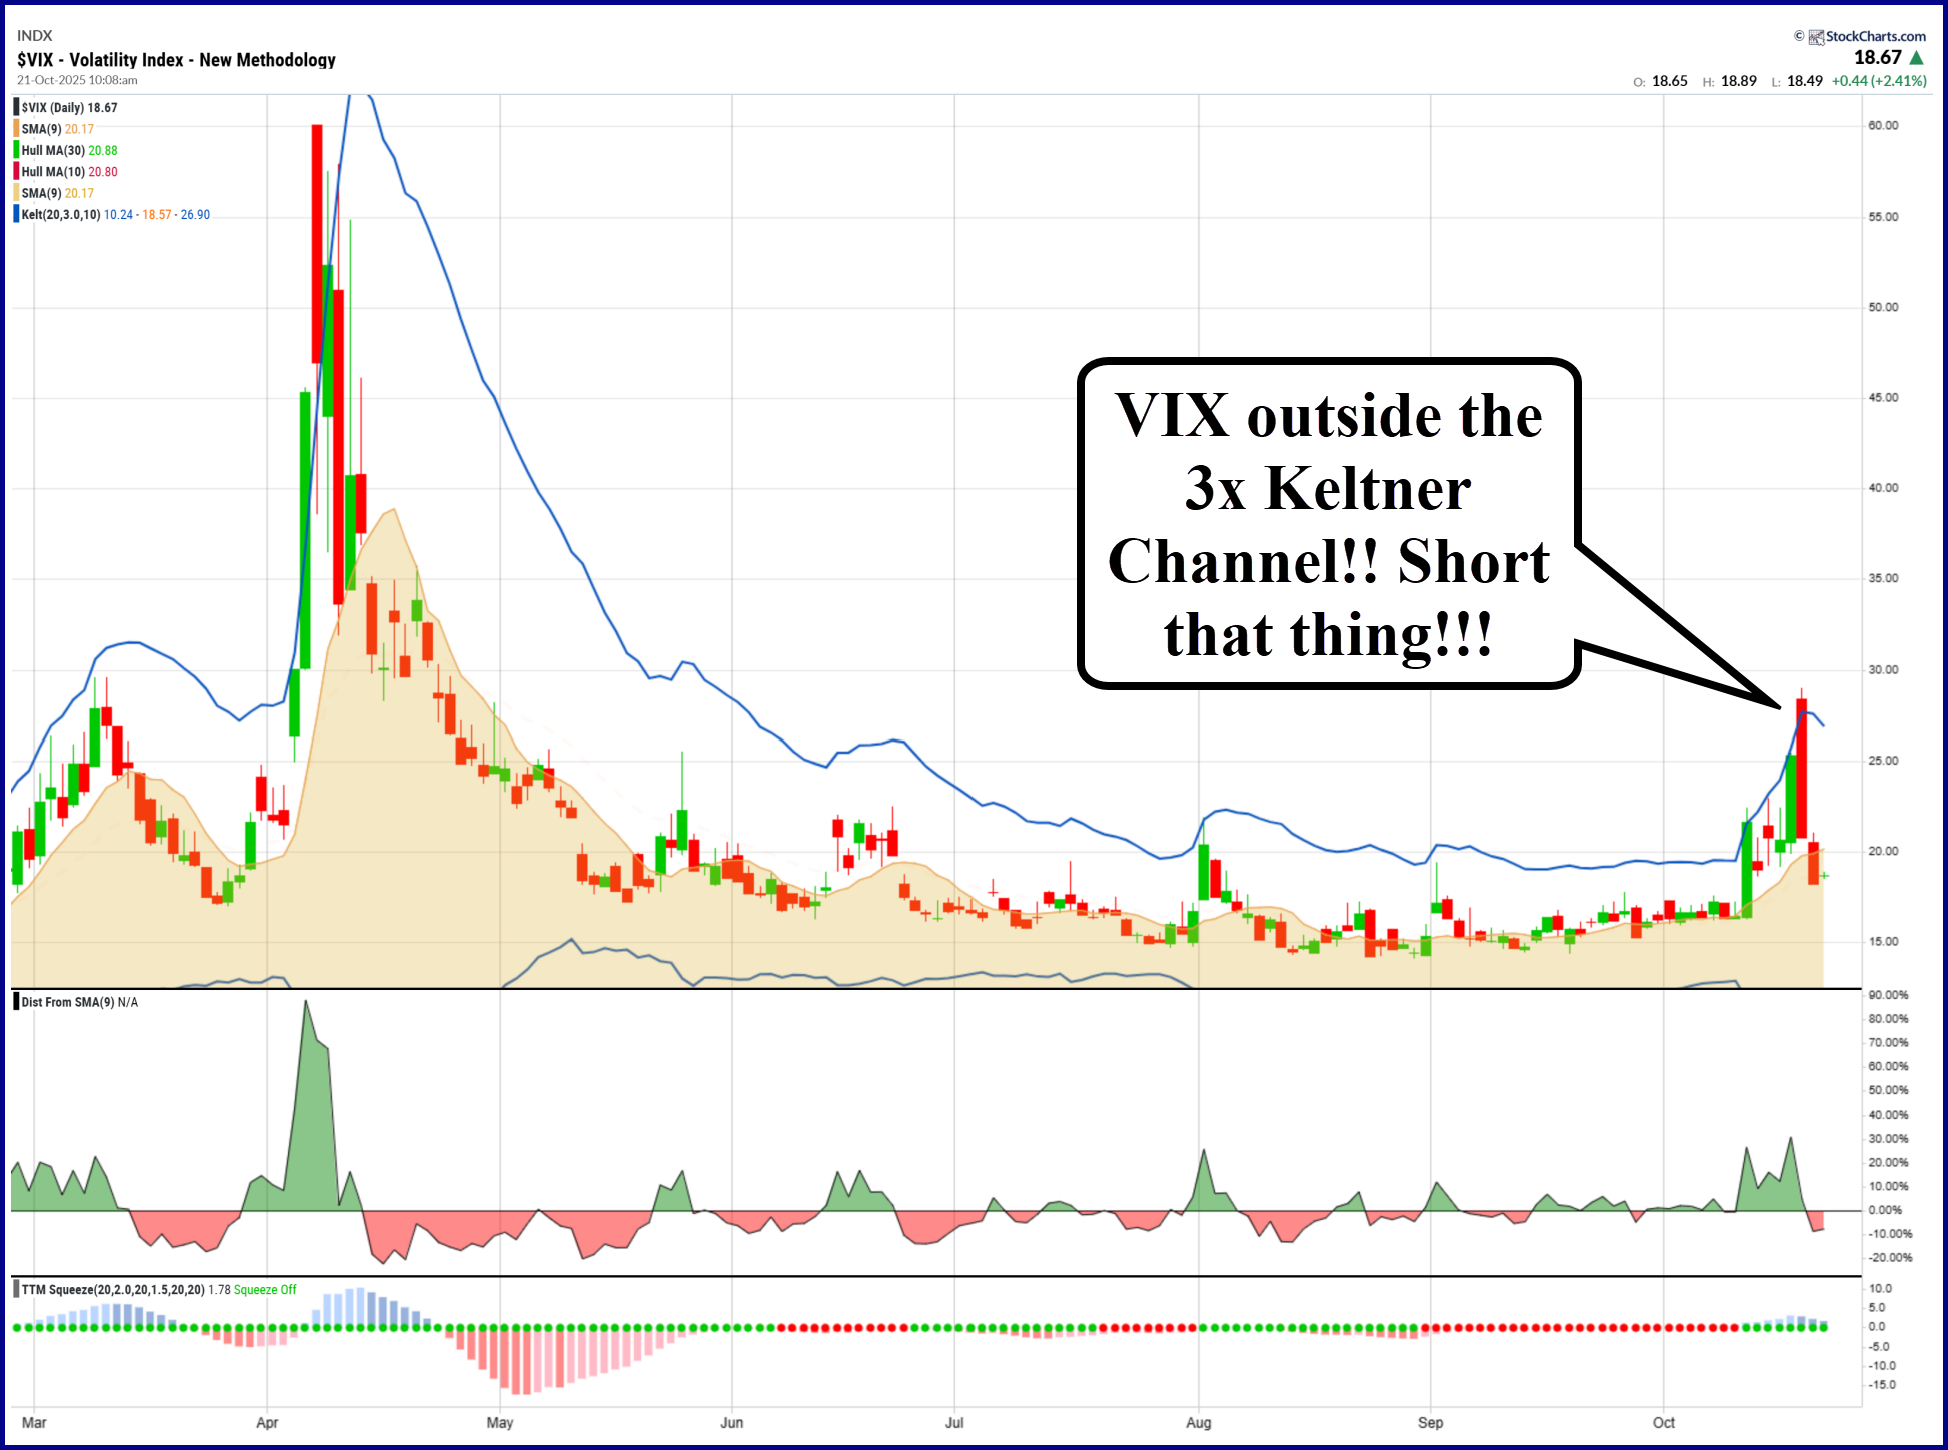
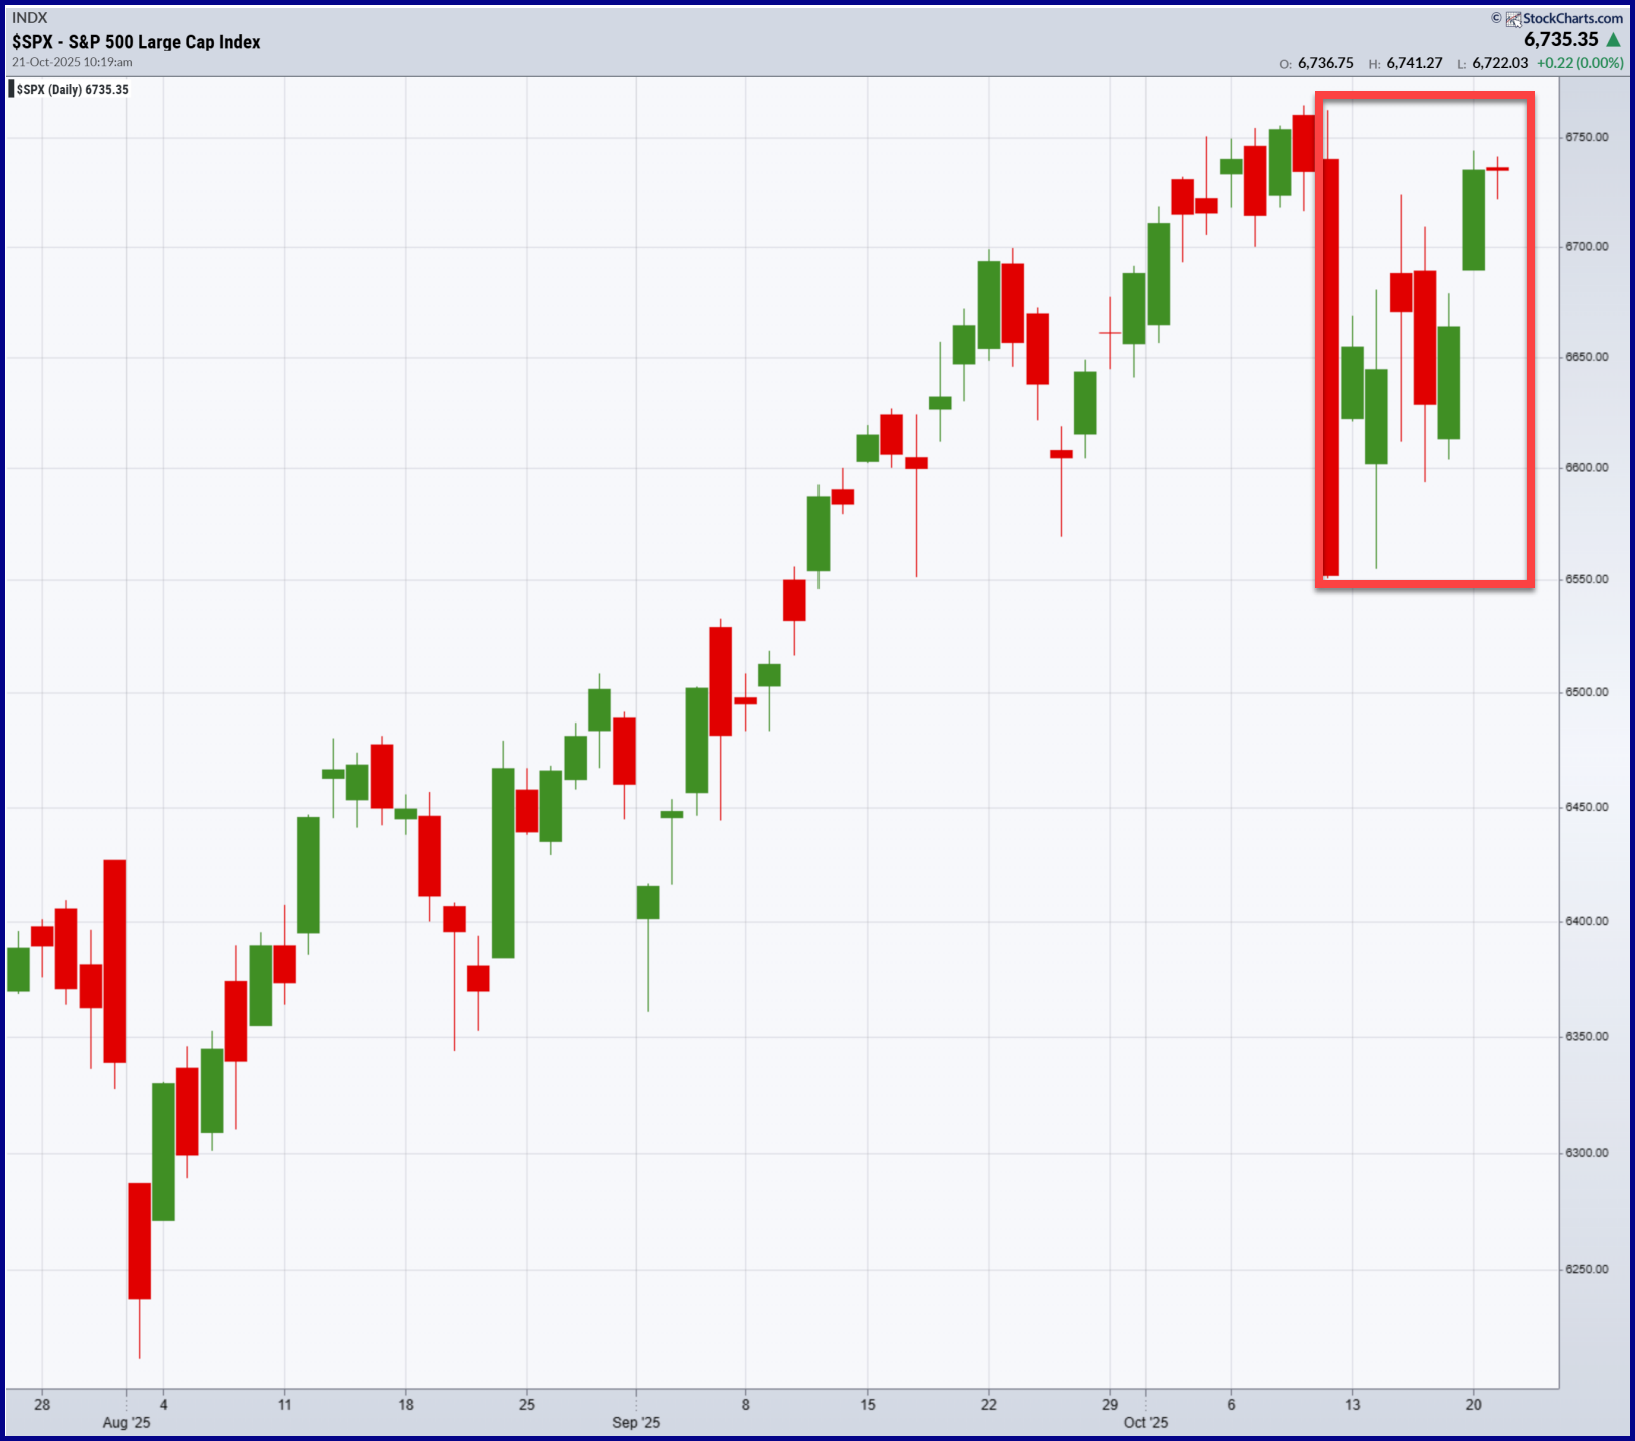
Equity markets rallied hard yesterday and, yes, we had a real vol crush. VIX dropped 2.55 points along with 4.53 on Friday. That’s a lot. For those purists who detest using % change on VIX (because it’s already a %), VX30 dropped 7.8% yesterday on top of 8.5% on Friday. I haven’t run the numbers on two-day drops, but that’s a big one.
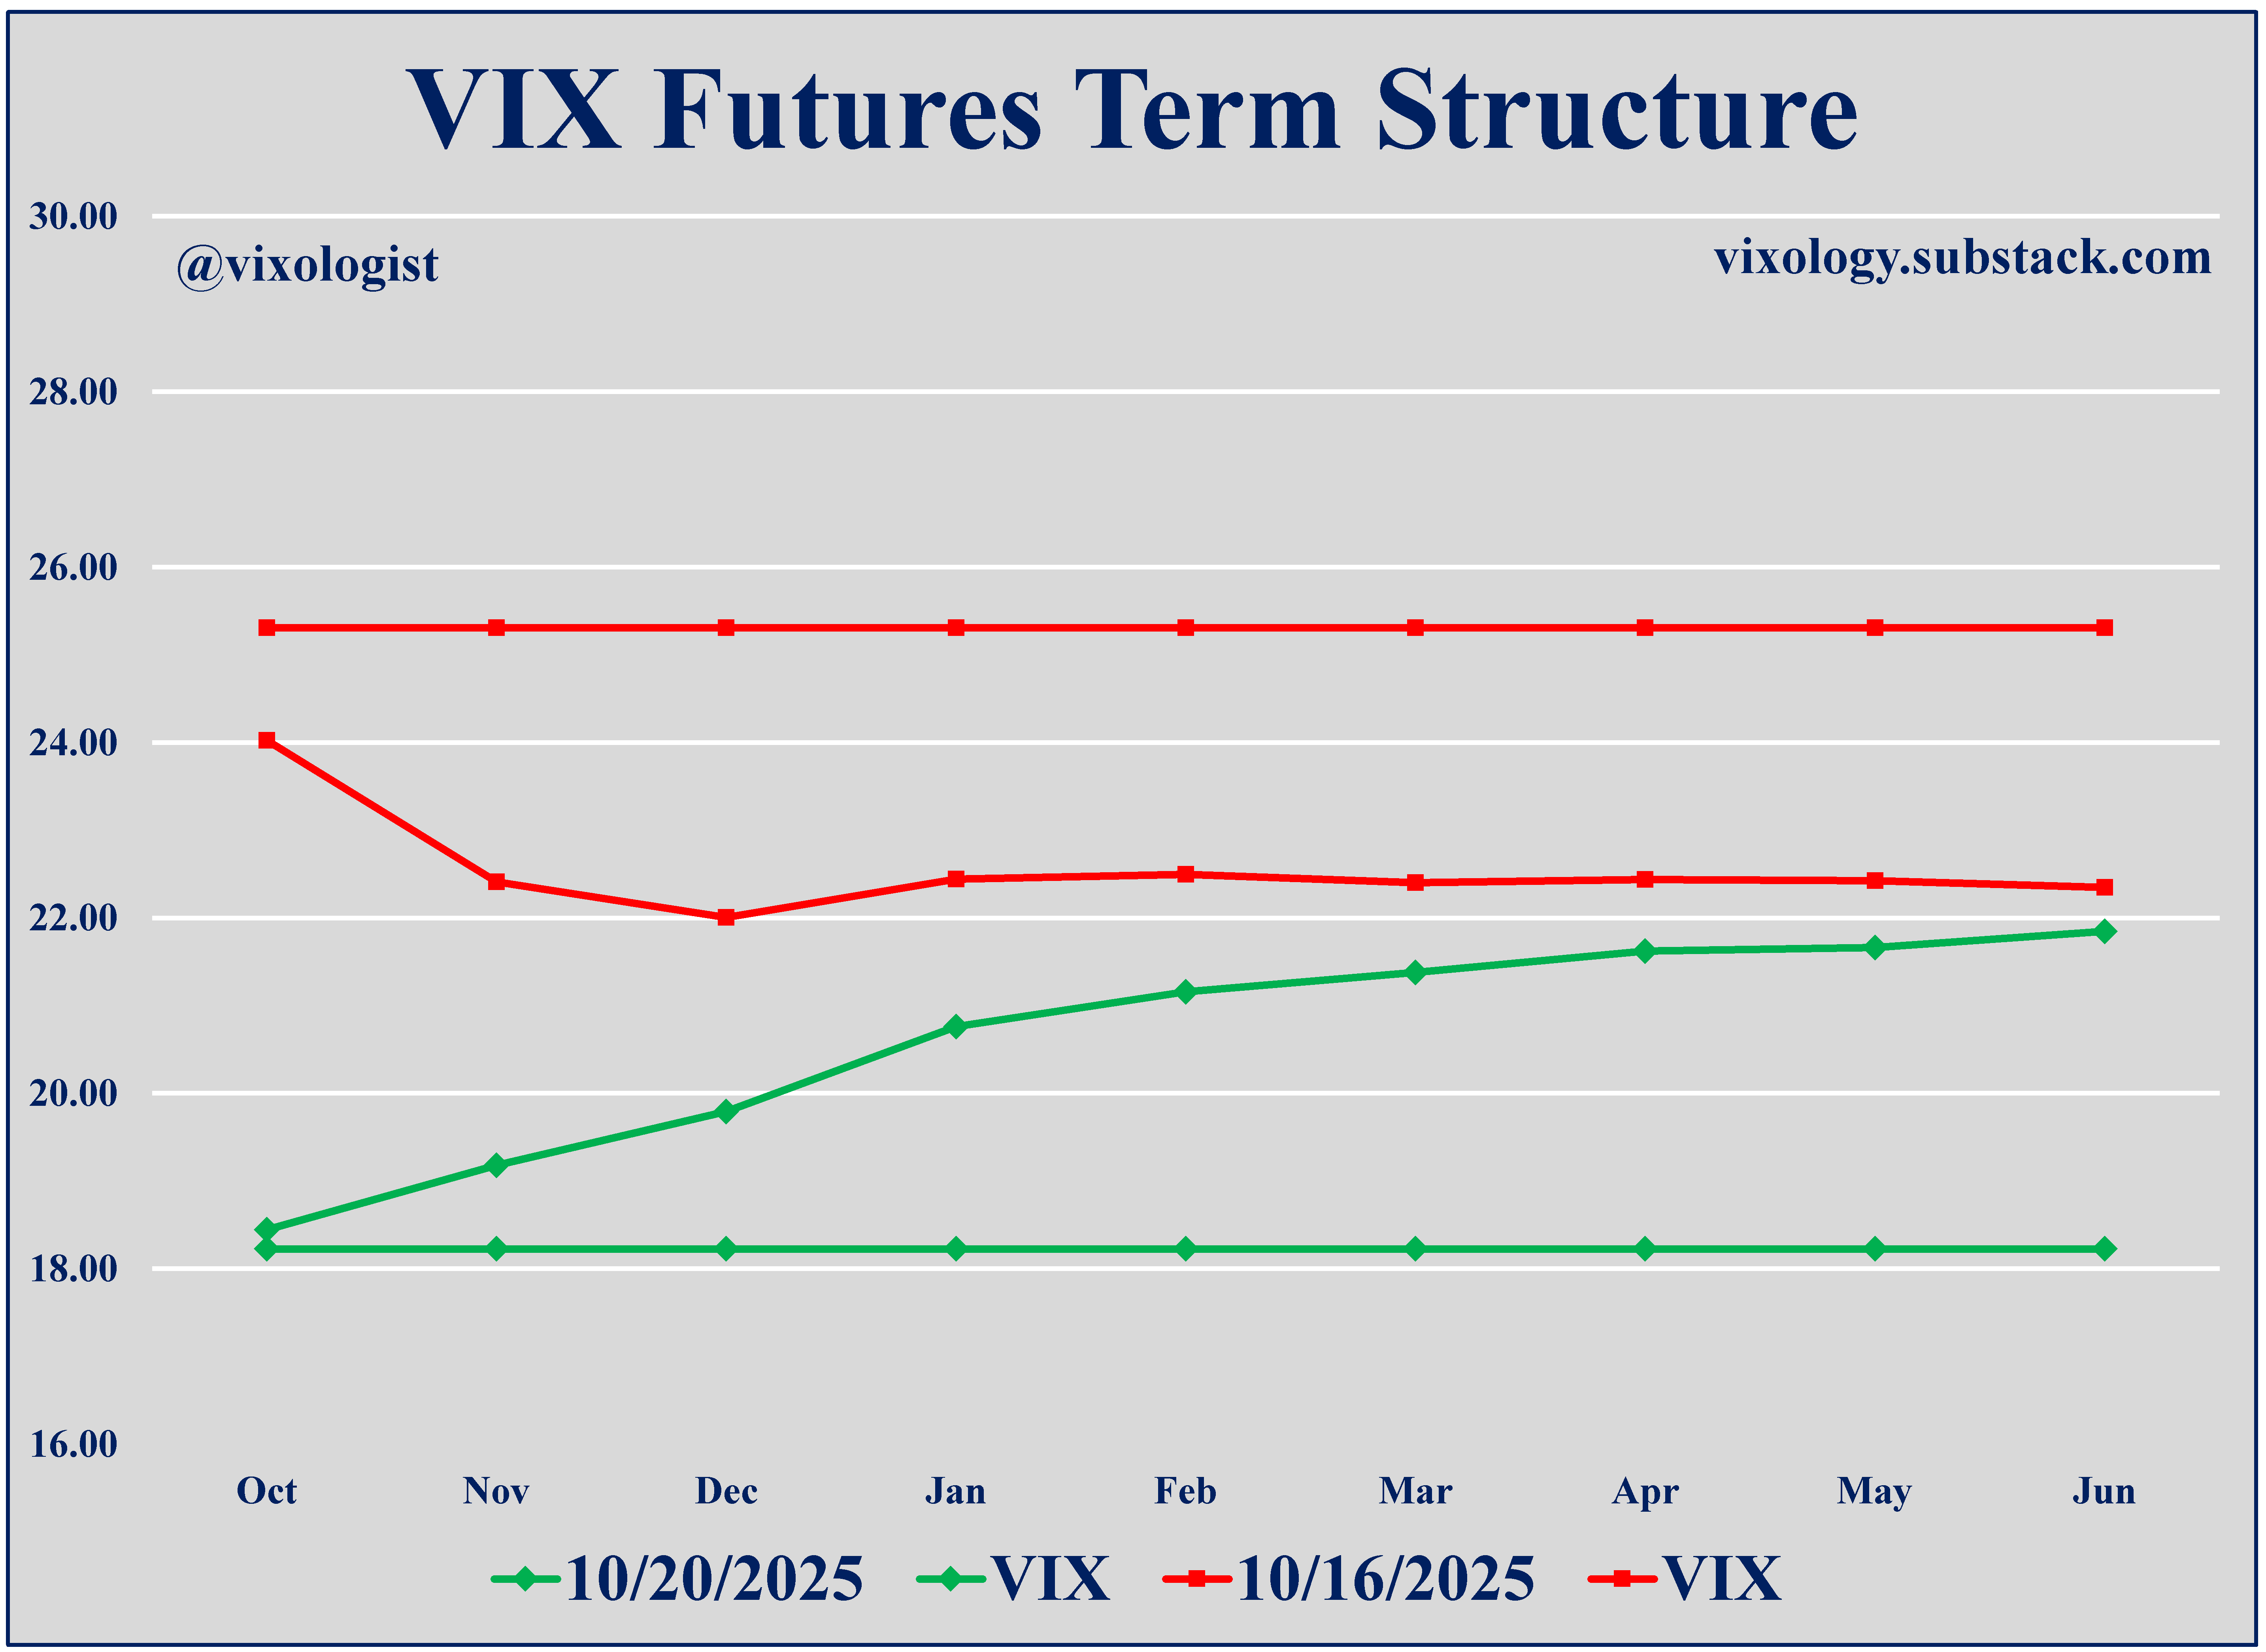
Turning that into a chart makes it easier to grasp the magnitude of the move. From pretty ugly backwardation of the futures with VIX hovering overhead to a decent contango structure and spot VIX back below where it belongs.
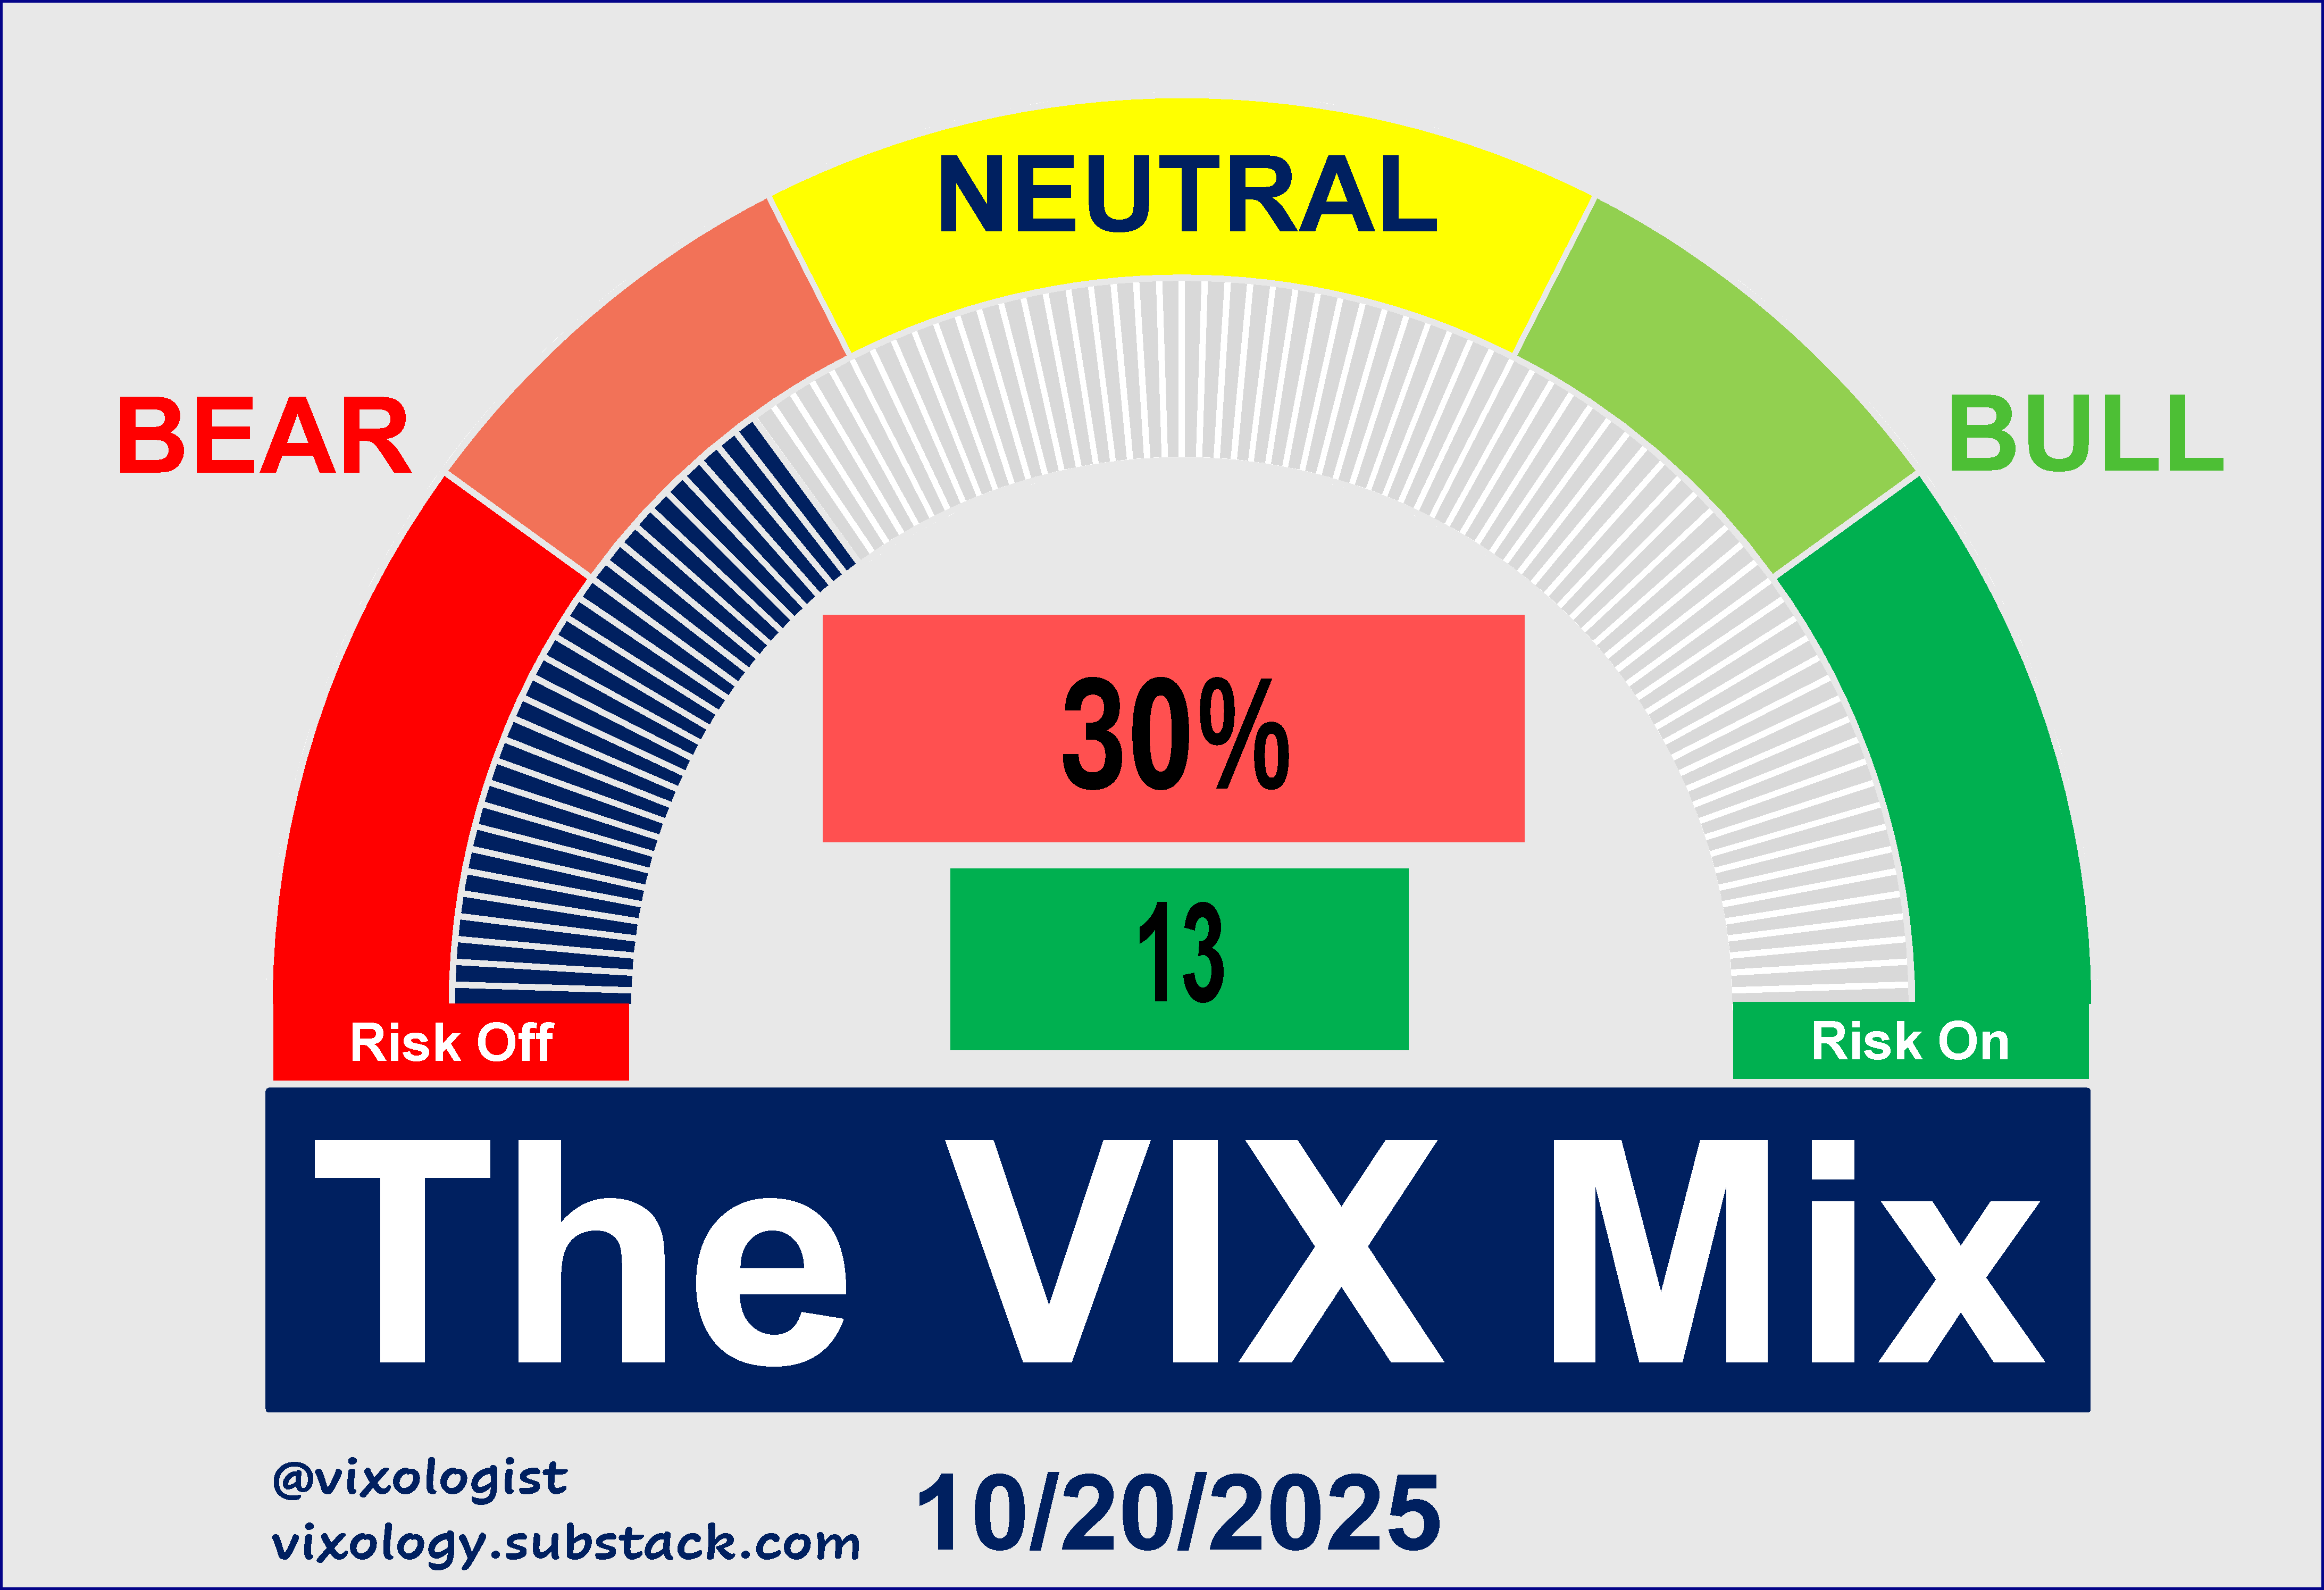
Given this dramatic improvement, the VIX Mix surely must have jumped out of the bearish zone it was in for six days in a row. Yeah, not so much. A 13 point improvement from Friday and a two-day move of 22 points are not enough to get us back into neutral.
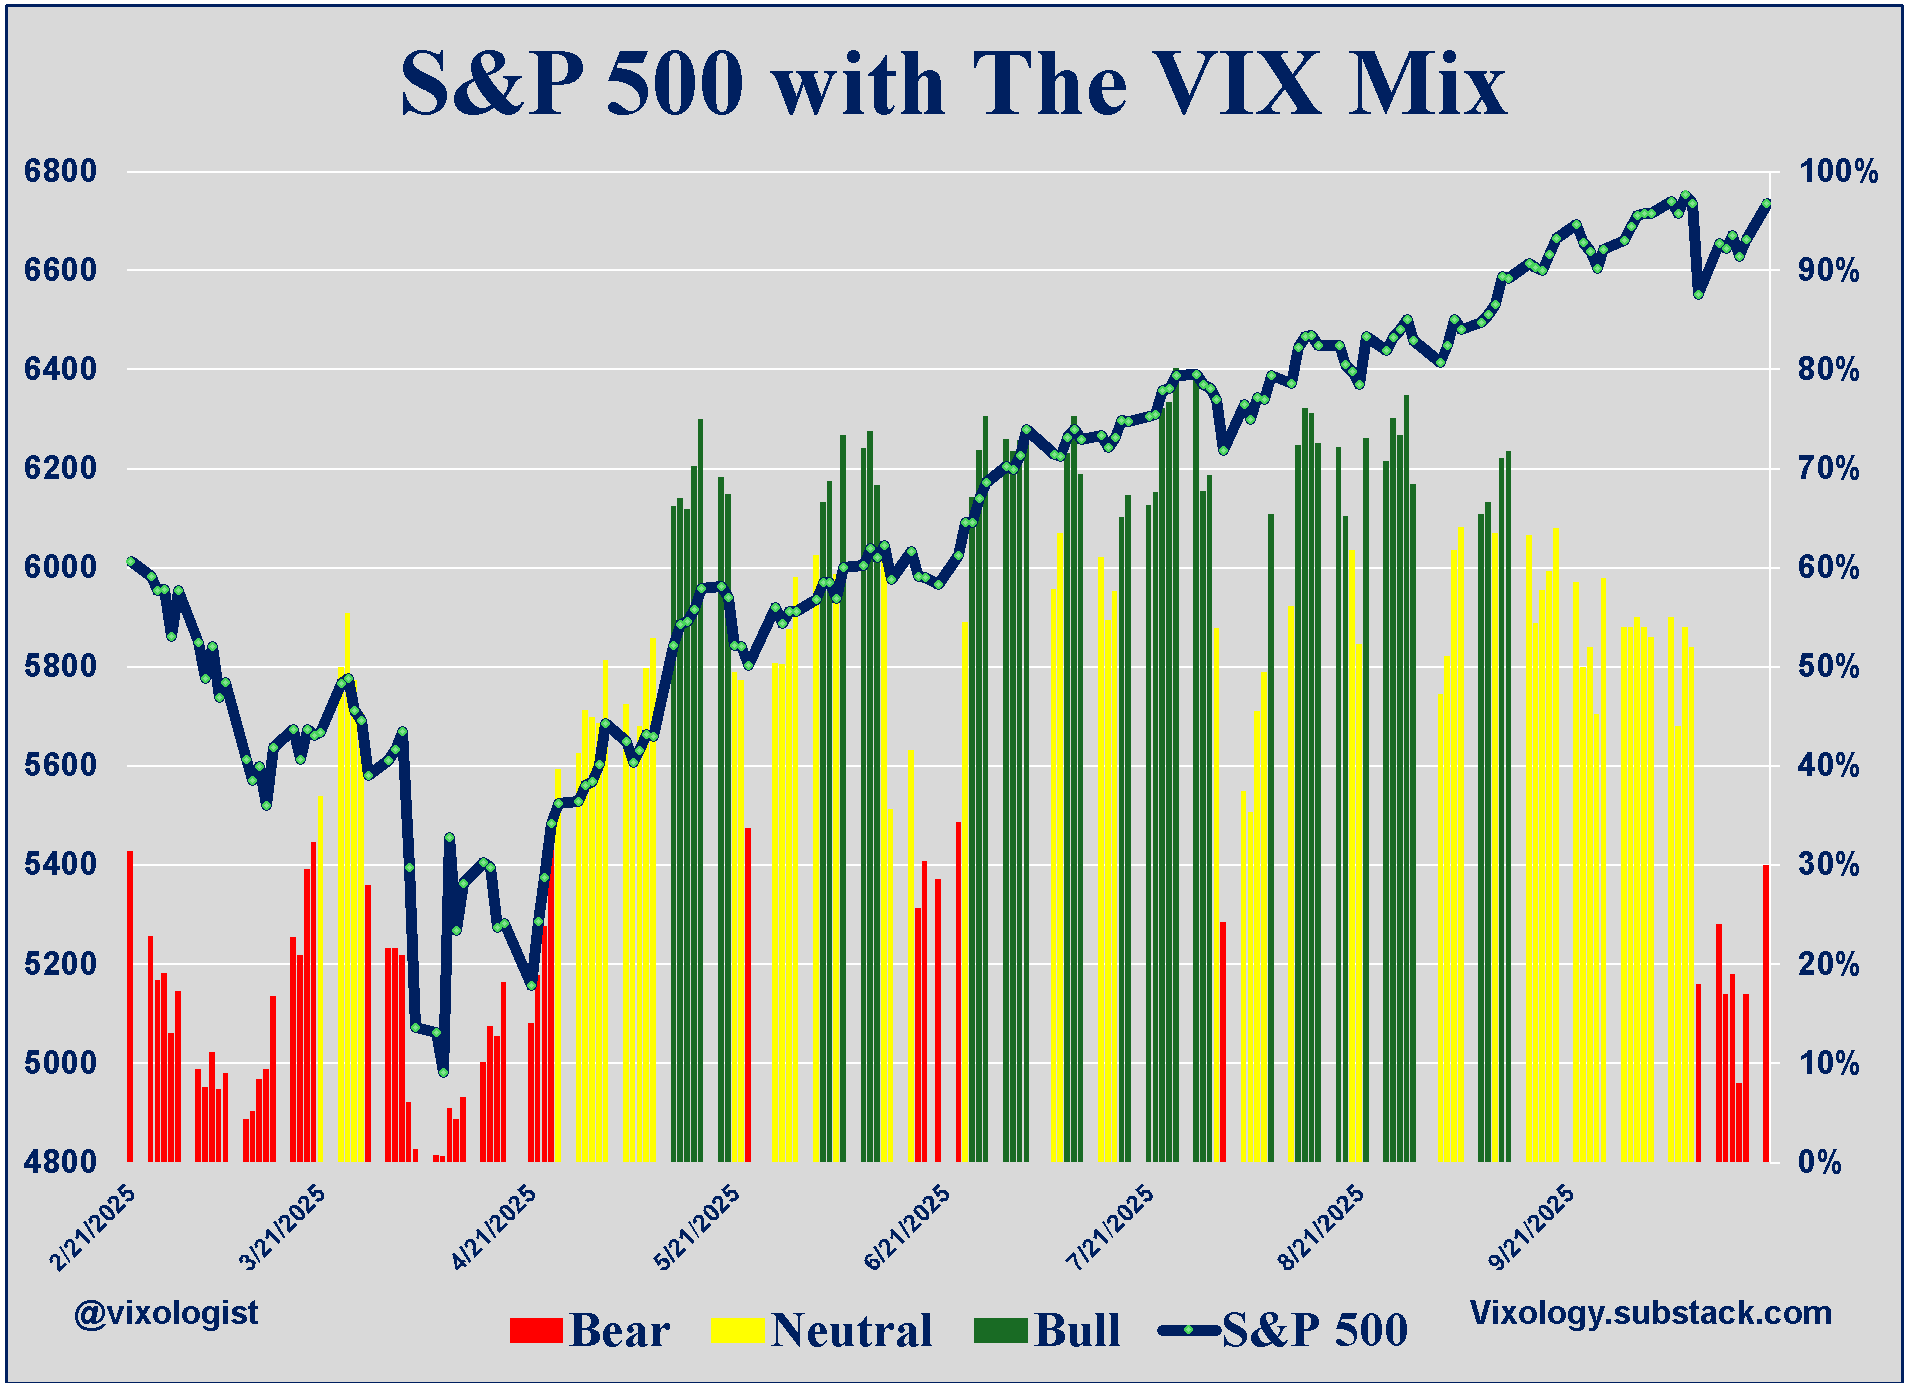
At last Thursday’s close, all 17 of the components were bearish. That improved to “only” 15 bearish on Friday with the other two in neutral. At yesterday’s close, we saw one component back in the green but there were still 12 hanging out in the red. Sometimes these vol events leave investors with a hangover that lasts more than two days.
Hindsight traders will tell you that last Friday’s VIX action told them it was time to get short vol. Good for them! The rest of the world was holding its breath until the end of the day when the crush had fully played out.
I suspect that the VIX Mix will continue to signal caution for a while given the hair-trigger response to the 10/10 tariff tantrum. After all, we are still stuck in the box.
The October VIX futures contract will expire tomorrow morning (sometimes results in a move related to repositioning of VIX option positions) and Friday will see the latest on CPI because there must be some government employees still doing the work. We are also entering the thick of earnings season that could bring some market moving announcements. And let’s not forget that we have the next Fed meeting the last week of the month. Equity markets remain resilient. No reason for long-term investors to make changes to portfolios they are comfortable owning. Short-term traders will be watching the box to see if the dip continues to be bought or there’s another play to the downside.
All content presented here is for informational and educational purposes only. Distribution of any content to any persons other than the recipient is unauthorized. Furthermore, any alteration of content presented here is prohibited. By accepting delivery of this presentation, the reader agrees to the foregoing. Certain information presented herein has been obtained from third-party sources considered to be reliable, but there is no guarantee of completeness or accuracy and it should not be relied upon as such. There is no obligation to update or correct any information presented. Readers should not treat any statement, opinion or viewpoint expressed herein as a solicitation or recommendation to buy or sell any security or follow any investment strategy. This material does not consider the investment objectives, financial situation, or needs of any particular reader. Readers should seek advice from a qualified financial or investment advisor prior to making any investment decision.
I am relatively new to Substack and to Vixology, which I am finding pretty amazing in helping me harness the VIX, but can anyone help me understand the VIX futures term structure chart? What’s the difference between the green and red VIX lines? Is it backwards looking because I am confused about the contract dates vs the x-axis in months for which year?
Oops! Sent the last post trying to delete the last word. Nothing more to say except. I will definitely be following your work more closely in the future. Thanks again for all the fun music flashbacks and your keen VIX insight!